VictoriaMetrics: High CPU and memory usage when vmagent fails to read SD file (even if logging disabled)
Describe the bug
I am using vmagent on linux to scrape 3 targets including node-exporter. Each target is configured in a separate scrape config file: promscrape.config:
global:
  scrape_interval: 60s

scrape_config_files:
  - /etc/prom_scrape_configs/*/*.yml
scrape_config_file example:
- job_name: "vmagent"
  file_sd_configs:
  - files: ["/opt/directoryname/data/prom_sd.json"]

  relabel_configs:
  - action: replace
    source_labels: [__address__]
    target_label: "instance"

  - action: replace
    target_label: "__address__"
    replacement: "http://localhost:8429"
I am using a json service discovery file (/opt/directoryname/data/prom_sd.json) to add target labels.
When vmagent fails to read the file /opt/directoryname/data/prom_sd.json (permissions changed, file deleted), it starts throwing the following error:
vmagent[676]: 2023-03-07T17:09:50.737Z#011error#011VictoriaMetrics/lib/promscrape/scraper.go:361#011skipping duplicate scrape target with identical labels; endpoint=http://localhost:8429/metrics, labels={__vm_filepath="/opt/directoryname/data/prom_sd.json",department="deptA",instance="instancename",job="vmagent",location="locationA"}; make sure service discovery and relabeling is set up properly; see also https://docs.victoriametrics.com/vmagent.html#troubleshooting; original labels for target1: {__address__="instancename",__meta_filepath="/opt/directoryname/data/prom_sd.json",__metrics_path__="/metrics",__scheme__="http",__scrape_intervroot
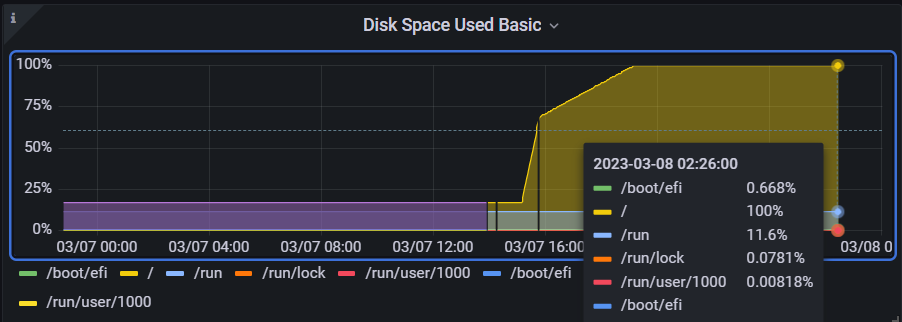
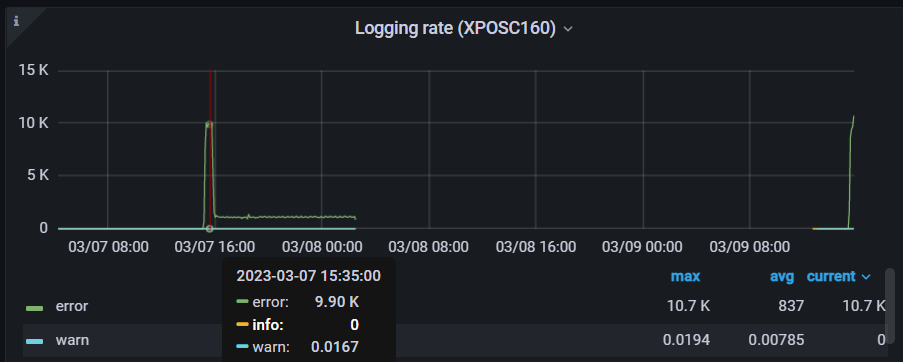
I noticed that this error was being logged at a rate 1000/s causing the syslog to fill up and the device to run out of disk space:
~# tail -n1000000 /var/log/syslog.1 | grep vmagent | cut -d : -f1-2 | uniq -c
  71007 Mar  7 18:54
  83244 Mar  7 18:55
  30399 Mar  7 18:56
  64325 Mar  7 18:57
  87579 Mar  7 18:58
  28986 Mar  7 18:59
  62063 Mar  7 19:00
102993 Mar  7 19:01
  29283 Mar  7 19:02
  69783 Mar  7 19:03
  92313 Mar  7 19:04
  29292 Mar  7 19:05
  69551 Mar  7 19:06
  89819 Mar  7 19:07
  29911 Mar  7 19:08
  59266 Mar  7 19:09
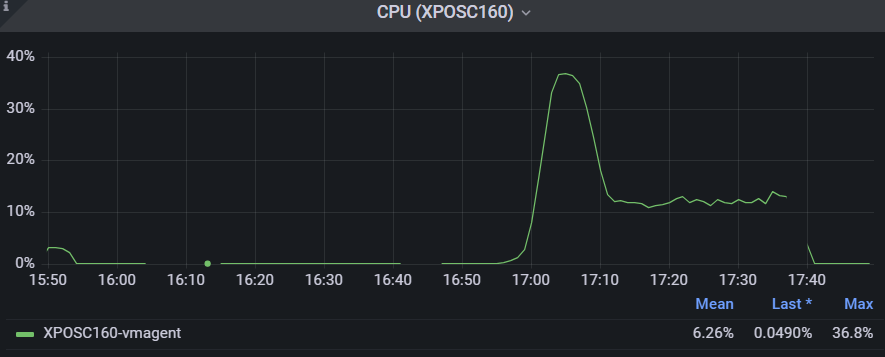
Not only that, but the CPU and memory usages increased as well:
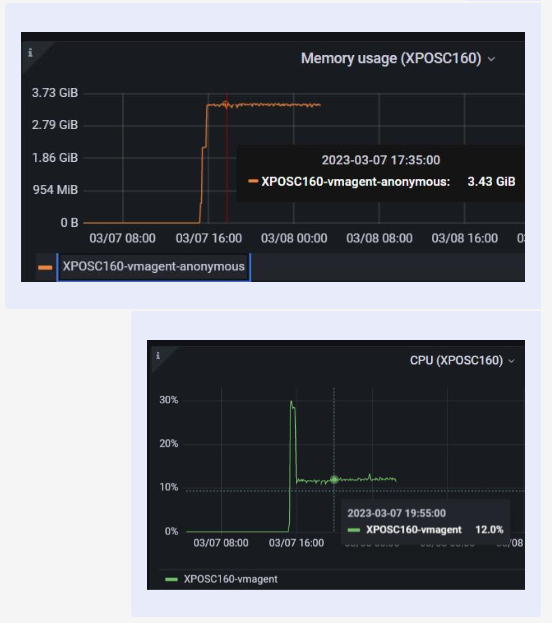
Initially I thought that the high CPU and memory could be caused by the excessive logging so I tried to use the flag -promscrape.suppressDuplicateScrapeTargetErrors to suppress the Duplicate Scrape Target Errors and check if the CPU and memory usage remain low; errors were suppressed however, the CPU and memory usages increased again:
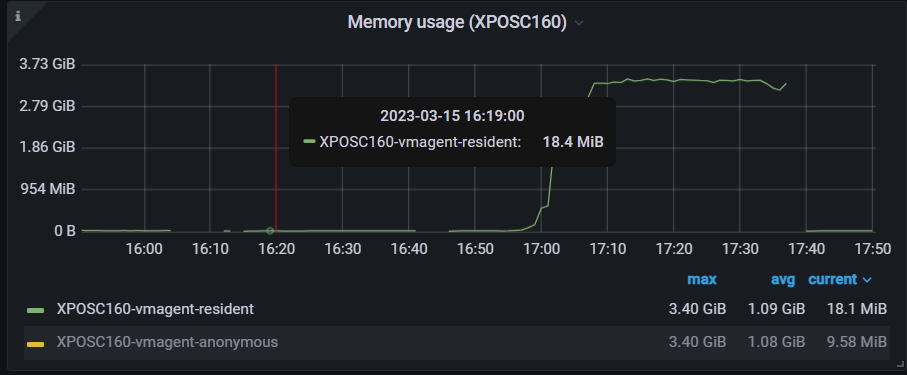
Finally when I reverted the changes (set the correct permissions to the sd file) vmagent was able to read the file again and the CPU usage decreased to 12%, however, the memory usage stayed the same. It wasn’t until I restarted vmagent that CPU and memory usages went back to normal values.
To Reproduce
- Use the same configuration in the description
- start vmagent
- delete the sd file or change the permissions so that vmagent cannot read it
- check cpu and memory usage
Version
v1.86.1
Logs
No response
Screenshots
No response
Used command-line flags
No response
Additional information
No response
About this issue
- Original URL
- State: closed
- Created a year ago
- Reactions: 1
- Comments: 20 (9 by maintainers)
Commits related to this issue
- lib/promscrape: do not re-use previously loaded scrape targets on failed attempt to load updated scrape targets at file_sd_configs The logic employed for re-using the previously loaded scrape target ... — committed to VictoriaMetrics/VictoriaMetrics by valyala a year ago
- lib/promscrape: do not re-use previously loaded scrape targets on failed attempt to load updated scrape targets at file_sd_configs The logic employed for re-using the previously loaded scrape target ... — committed to VictoriaMetrics/VictoriaMetrics by valyala a year ago
- lib/promscrape: do not re-use previously loaded scrape targets on failed attempt to load updated scrape targets at file_sd_configs The logic employed for re-using the previously loaded scrape target ... — committed to VictoriaMetrics/VictoriaMetrics by valyala a year ago
- lib/promscrape: do not re-use previously loaded scrape targets on failed attempt to load updated scrape targets at file_sd_configs The logic employed for re-using the previously loaded scrape target ... — committed to VictoriaMetrics/VictoriaMetrics by valyala a year ago
- lib/promscrape: do not re-use previously loaded scrape targets on failed attempt to load updated scrape targets at file_sd_configs The logic employed for re-using the previously loaded scrape target ... — committed to VictoriaMetrics/VictoriaMetrics by valyala a year ago
- lib/promscrape: do not re-use previously loaded scrape targets on failed attempt to load updated scrape targets at file_sd_configs The logic employed for re-using the previously loaded scrape target ... — committed to VictoriaMetrics/VictoriaMetrics by valyala a year ago
The bugfix has been included in vmagent v1.87.5 LTS. Closing the issue as fixed then.
@dmitryk-dk we tried it and it worked. The “duplicate scrape target” error is no longer being logged and the cpu and memory usages did not increase.
Hi @cah-jad-baz ! I have reproduced this problem. Now I’m looking at what affects this behavior
@dmitryk-dk
This is our prom_sd.json file
This setup is for an IOT-like use-case We need to add labels to vmagent that are supplied by another application (iot agent) running on that device fetching labels from an upstream API Those labels are then persisted to prom_sd.json They are then used to add labels when scraping vmagent, node-exporter and our main custom app jobs If new labels are provided from our upstream app, those are immediately saved in prom_sd.json which is refreshed once a minute by vmagent and the change can be viewed on Grafana within a few minutes
That’s the use-case we’re trying to cater for Aside from this bug, this has been working perfectly
We need vmagent, node-exporter and our main custom app to all share the same discovery labels saved on disk by our iot agent provided from our upstream API As such, we are using the discovery mechanism for a very different use-case than what it is normally used for We have only one target per job The aim of the SD file is not to discover targets but to provide labels
As such, the only target provided is the instance name (of the IOT device) “instance” is replaced with the target supplied Then for vmagent, we set the address to localhost:8429
For node-exporter, we reuse that exact SD setup but replace the address with localhost:9100 Here is the full scrape_config_file with node-exporter to illustrate the use-case