VictoriaMetrics: Grafana Table doesn't merge queries results with Victoria Metrics datasource
Describe the bug Switching datasource from Prometheus to Victoria Metrics in Grafana Tables breaks row merging for the same data. We are trying to use VictoriaMetrics as long-term historical metrics storage for our Kubernetes in-cluster Prometheus. Have configured Prometheus to send data to VictoriaMetrics via remote_write api.
To Reproduce
- Install VictoriaMetrics single node helm chart.
- Add remote_write to VM in Prometheus config.
- Change datasource from prometheus to VM in grafana dashboards with tables with multiple queries. No any other settings in Grafana changed.
- Queries results doesn’t merged anymore. See screenshots.
- Change datasouce back to Prometheus - tables look as it should.
Expected behavior Multiple queries results with same lebels should be merged to rows in Grafana Tables panel.
Screenshots
Prometheus datasource table result:

VictoriaMetrics datasource table result with same queries and settings:

Version
The line returned when passing --version command line flag to binary. For example:
$ ./victoria-metrics-prod --version
victoria-metrics-20200815-125320-tags-v1.40.0-0-ged00eb3f3
About this issue
- Original URL
- State: closed
- Created 4 years ago
- Comments: 20
Commits related to this issue
- app/vmselect: use `time` value rounded to seconds if it isnt passed to `/api/v1/query` Updates https://github.com/VictoriaMetrics/VictoriaMetrics/issues/720 — committed to VictoriaMetrics/VictoriaMetrics by valyala 4 years ago
- app/vmselect: use `time` value rounded to seconds if it isnt passed to `/api/v1/query` Updates https://github.com/VictoriaMetrics/VictoriaMetrics/issues/720 — committed to VictoriaMetrics/VictoriaMetrics by valyala 4 years ago
- app/vmselect/prometheus: return timestamps from `/api/v1/query`, which match the `time` query arg Updates https://github.com/VictoriaMetrics/VictoriaMetrics/issues/720 — committed to VictoriaMetrics/VictoriaMetrics by valyala 4 years ago
- app/vmselect/prometheus: return timestamps from `/api/v1/query`, which match the `time` query arg Updates https://github.com/VictoriaMetrics/VictoriaMetrics/issues/720 — committed to VictoriaMetrics/VictoriaMetrics by valyala 4 years ago
@hagen1778 I think its because when “instant” is used it returns time for as <current time> - 30s (or current value of search.latencyOffset param set for vmselect) instead of actual time for this metric. And because queries may complete in different time this timestamps may differ for 1-2-10-inf ms, and it breaks the table. Examples. Not OK: (3ms offset for metrics scraped in one time)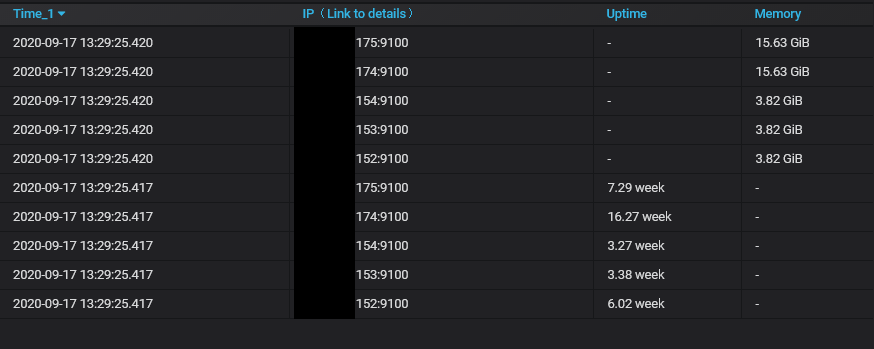 OK (after 10 refreshes):
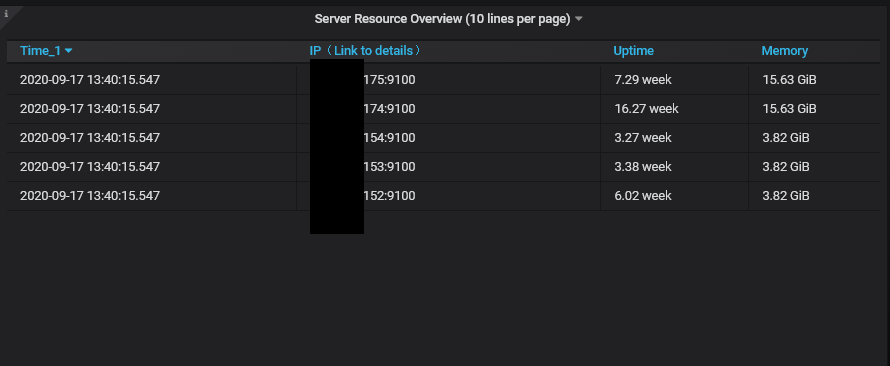 Nothing was changed in queries, and dashboards, only few refreshes.
Unfortunately it is impossible to downgrade from v1.41.* to older releases due to on-disk data format change. See release notes for v1.41.0 for details. So it is better waiting for the next release or building VictoriaMetrics from sources according to the following docs:
The fix will be included in the upcoming release, which is going to be published in the next couple of days.
@Muxa1L , thanks for the spot! It must be fixed in the following commits:
Unfortunately these commits weren’t included in v1.41.1, but they will be included in the next release.