VictoriaMetrics: High memory footprint for vmagent v1.55.1
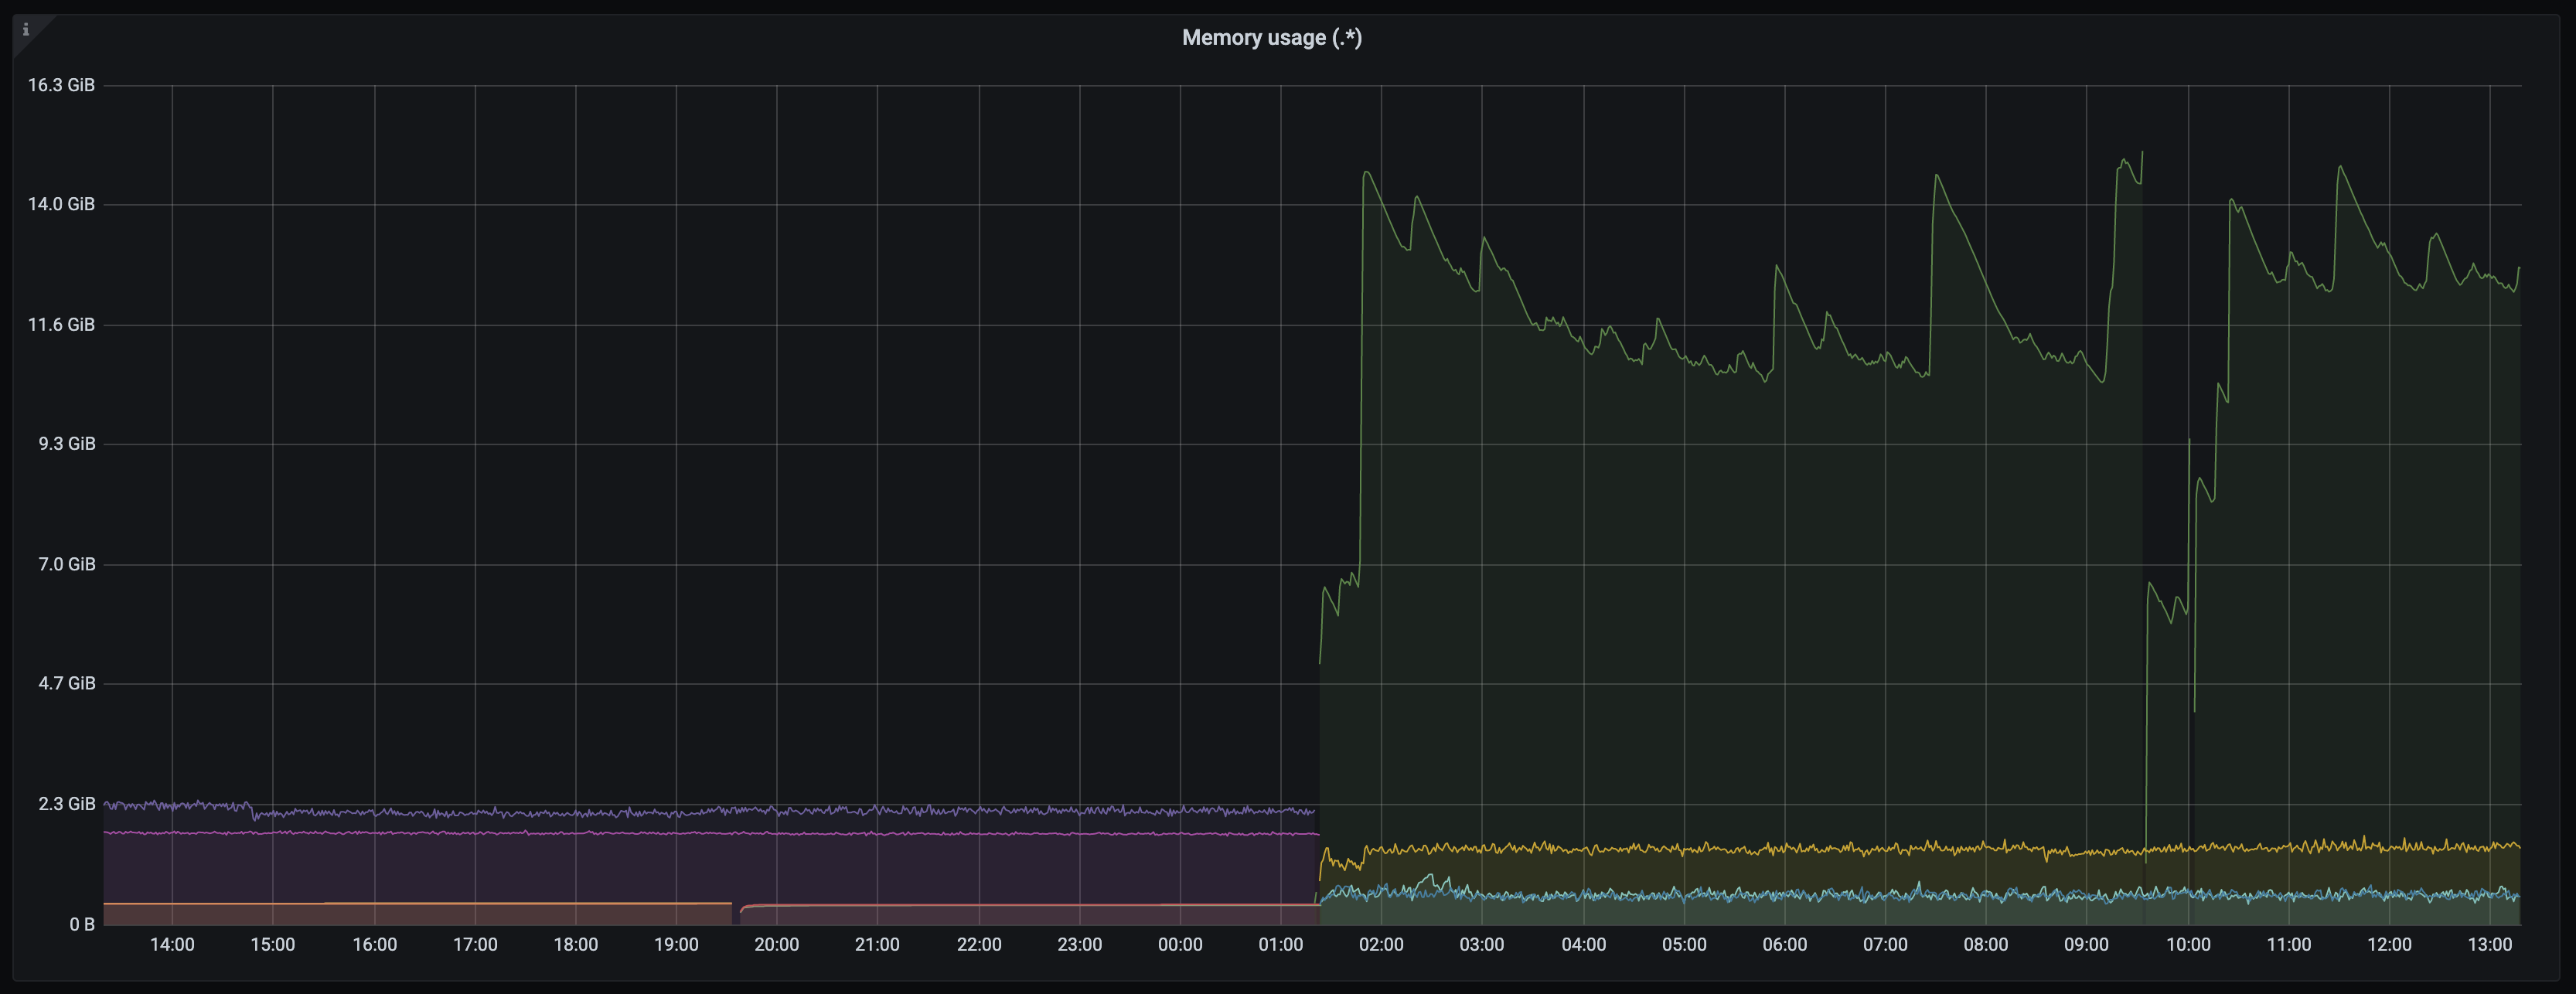
After upgrading from v1.53.1 to v1.55.1, I see a high memory footprint of vmagent.
Screenshots
If applicable, add screenshots to help explain your problem.
Version vmagent v1.55.1
Spec
    containers:
    - name: vmagent
      readinessProbe:
        initialDelaySeconds: 60
    extraArgs:
      promscrape.maxScrapeSize: 100MB
      promscrape.suppressDuplicateScrapeTargetErrors: "true"
      promscrape.suppressScrapeErrors: "true"
    image:
      repository: victoriametrics/vmagent
      tag: v1.55.1
    podScrapeNamespaceSelector: {}
    podScrapeSelector: {}
    relabelConfig:
      key: global_relabel.yaml
      name: monitoring-vmagent-cluster-relabel-config
    remoteWrite:
    - url: http://vminsert-monitoring-vmcluster-persistent.victoria-metrics.svc.cluster.local:8480/insert/0/prometheus/api/v1/write
      urlRelabelConfig:
        key: cluster_specific_relabel.yaml
        name: monitoring-vmagent-cluster-relabel-config
    replicaCount: 1
    resources:
      limits:
        cpu: 2
        ephemeral-storage: 10Gi
        memory: 16Gi
    serviceAccountName: vmagent
    serviceScrapeNamespaceSelector: {}
    serviceScrapeSelector: {}
About this issue
- Original URL
- State: closed
- Created 3 years ago
- Comments: 23
Commits related to this issue
- lib/promscrape/discovery/kubernetes: reduce memory usage when Kubernetes service discovery is configured on a big number of scrape jobs Previously vmagent was creating a separate Kubernetes object ca... — committed to VictoriaMetrics/VictoriaMetrics by valyala 3 years ago
- lib/promscrape/discovery/kubernetes: reduce memory usage when Kubernetes service discovery is configured on a big number of scrape jobs Previously vmagent was creating a separate Kubernetes object ca... — committed to VictoriaMetrics/VictoriaMetrics by valyala 3 years ago
- lib/promscrape/discovery/kubernetes: reduce memory usage further when big number of scrape jobs are configured for the same `kubernetes_sd_config` role Serialize reloading per-role objects, so they d... — committed to VictoriaMetrics/VictoriaMetrics by valyala 3 years ago
- lib/promscrape/discovery/kubernetes: reduce memory usage further when big number of scrape jobs are configured for the same `kubernetes_sd_config` role Serialize reloading per-role objects, so they d... — committed to VictoriaMetrics/VictoriaMetrics by valyala 3 years ago
- lib/promscrape/discovery/kubernetes: remove too verbose logs about starting and stopping the watchers Log the number of objects loaded per each watch url Updates https://github.com/VictoriaMetrics/V... — committed to VictoriaMetrics/VictoriaMetrics by valyala 3 years ago
- lib/promscrape/discovery/kubernetes: remove too verbose logs about starting and stopping the watchers Log the number of objects loaded per each watch url Updates https://github.com/VictoriaMetrics/V... — committed to VictoriaMetrics/VictoriaMetrics by valyala 3 years ago
- lib/promscrape/discovery/kubernetes: further optimize kubernetes service discovery for the case with many scrape jobs Do not re-calculate labels per each scrape job - reuse them instead for scrape jo... — committed to VictoriaMetrics/VictoriaMetrics by valyala 3 years ago
It does seem to use lower memory usage @valyala. I will monitor further for any spikes.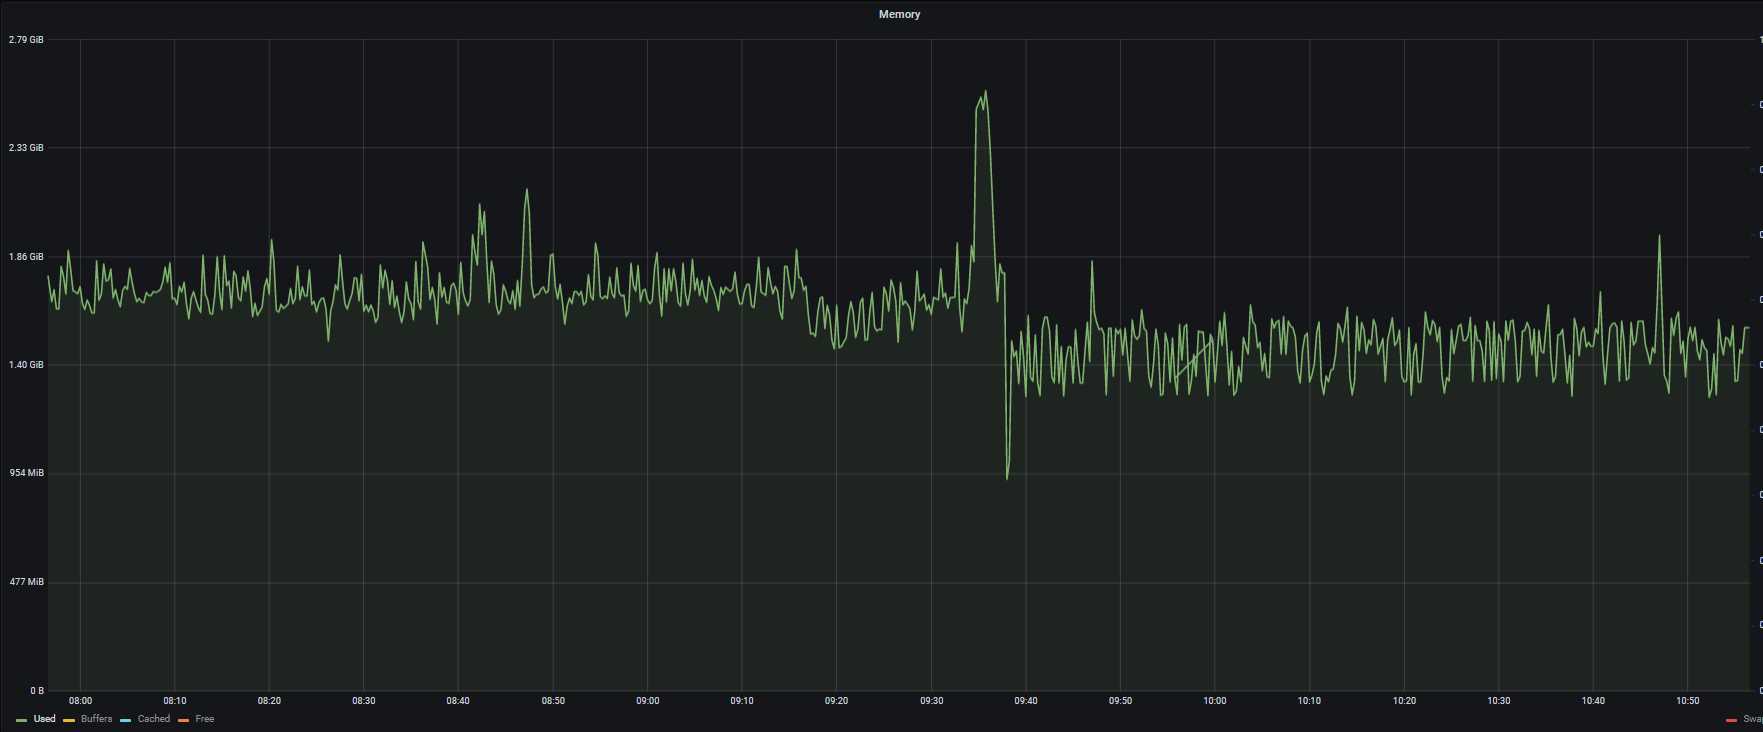
The commit 4b18a4f026b301344e7fafb3dfec745b54fee23e should reduce logging verbosity when reloading
-promscrape.configwith big number of scrape config jobs.