VictoriaMetrics: vmstorage is stuck at some disk intensive operation
Describe the bug
I should first say that’s a bizarre case:
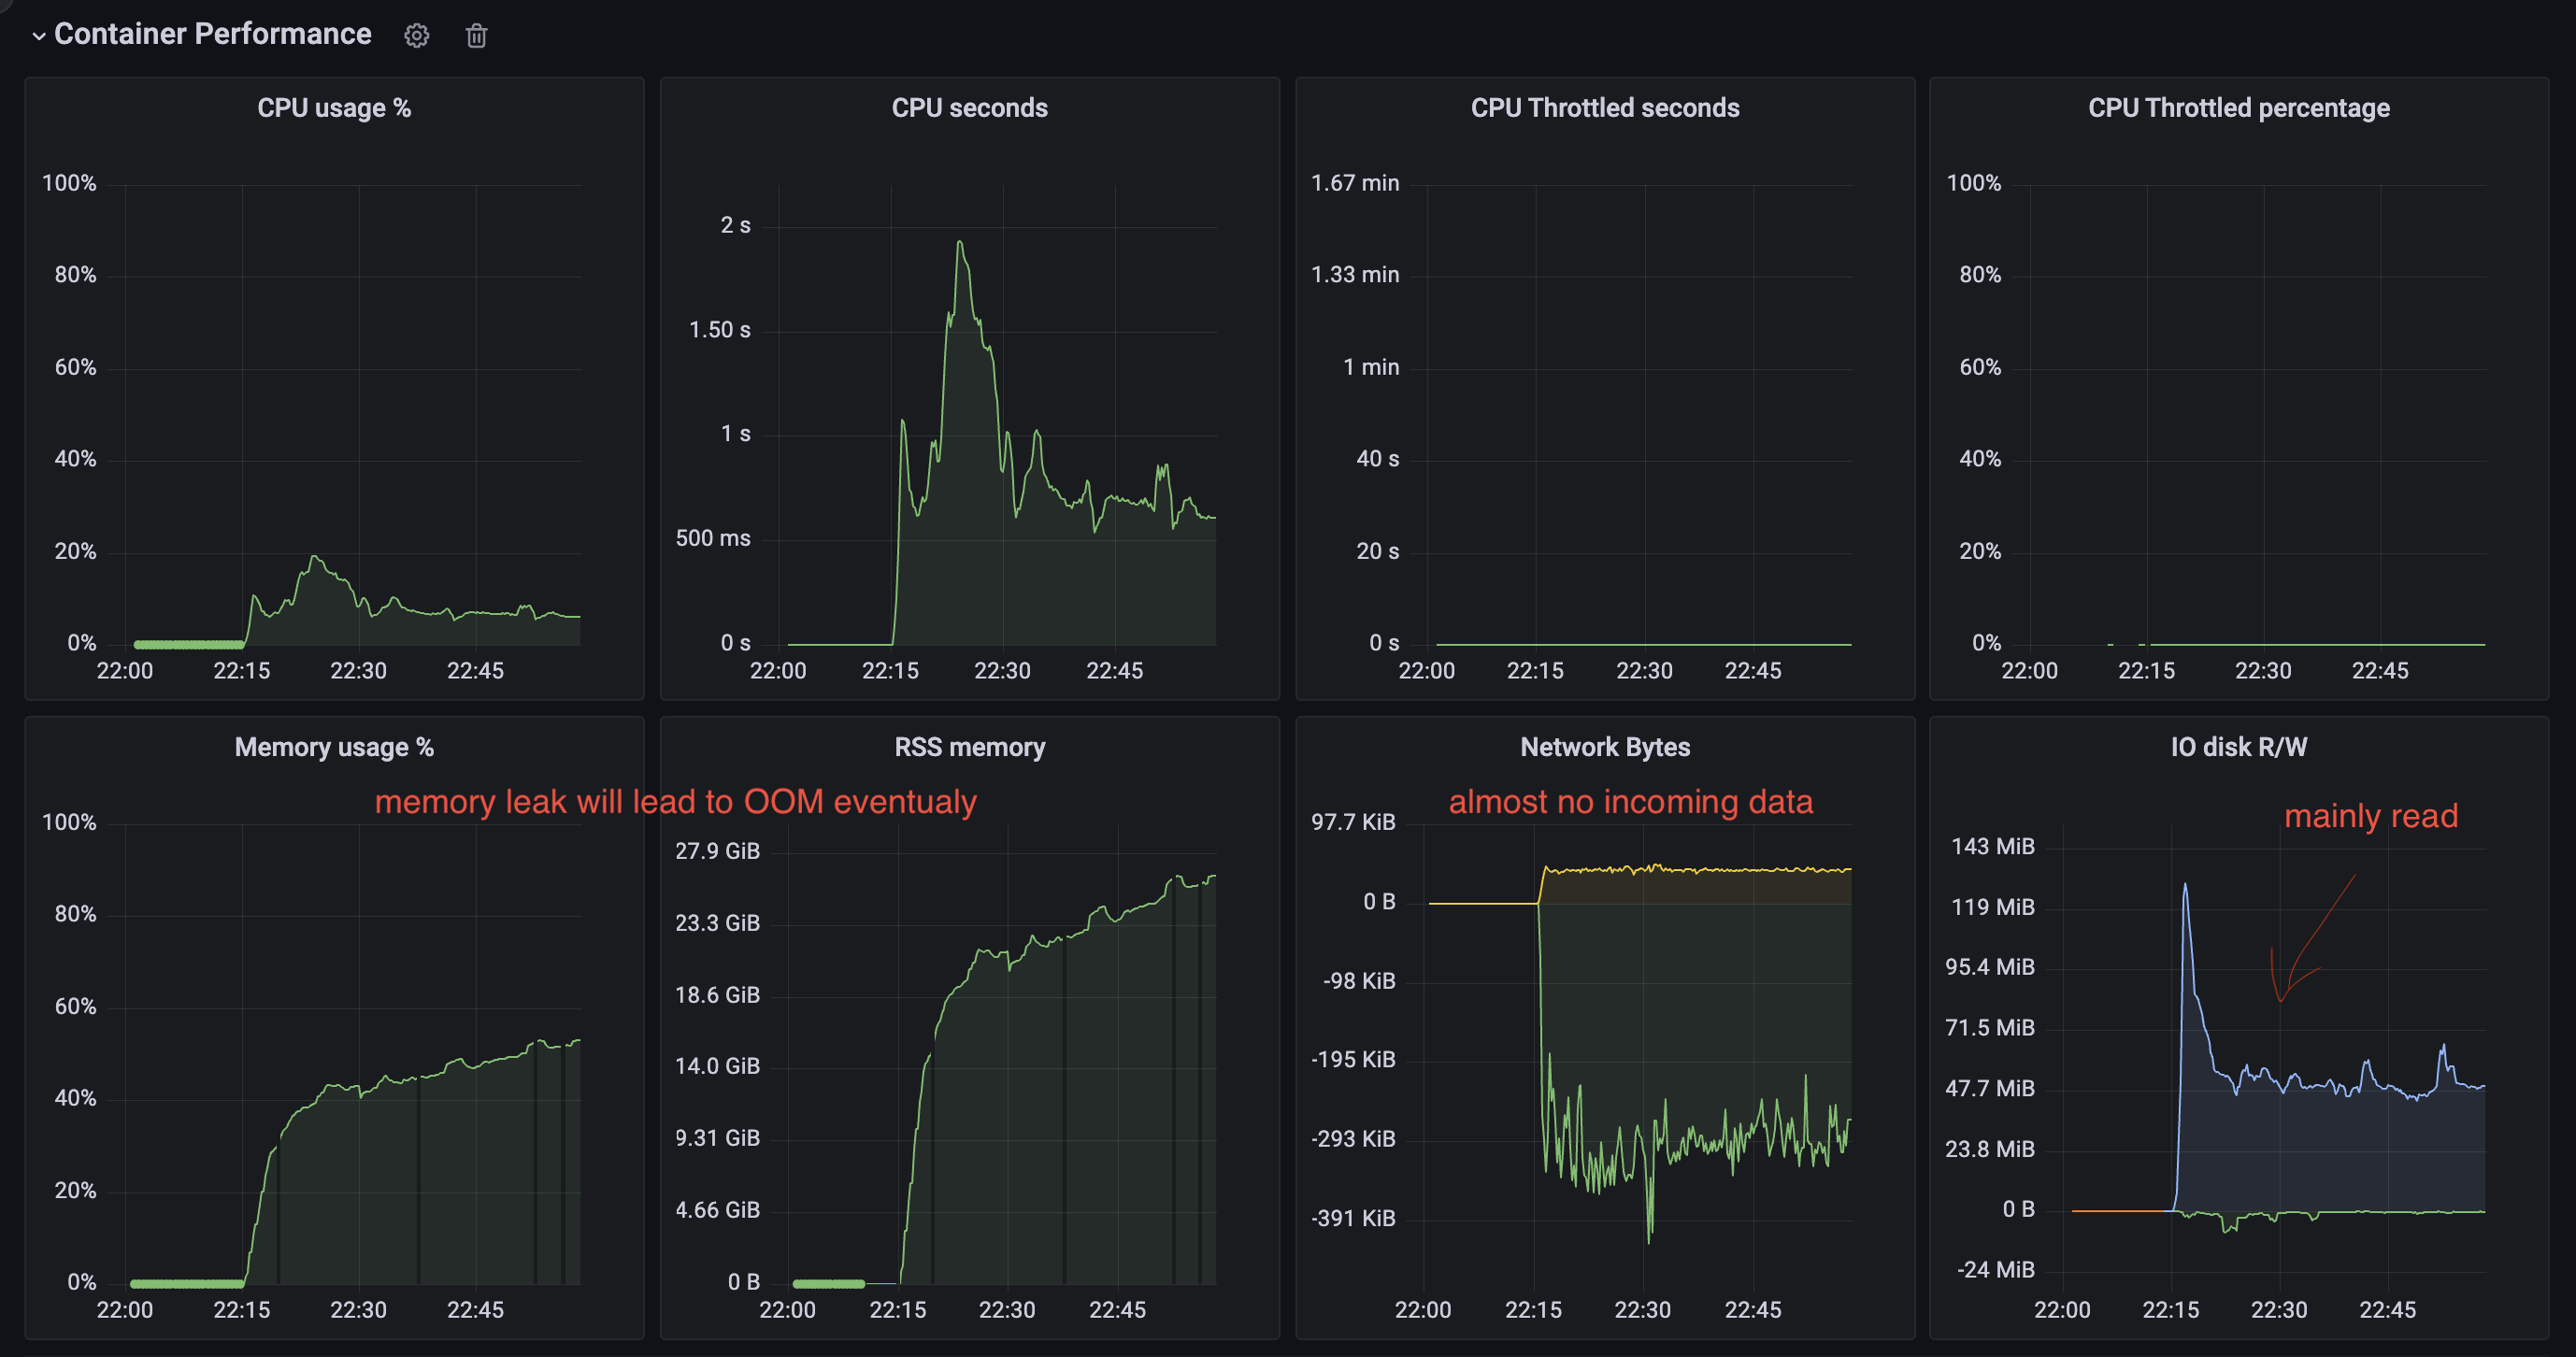
There is a cluster with 6 shards of vmstorage components. At some point, when we decided to shrink memory for a Pod a bit (60GB --> 50GB because we added more shards before) we faced a problem when one of the vmstorage stuck in some Disk operation and stopped receiving data (or receiving significantly less than it should). Returning memory back didn’t help.
This pod blocks data ingestion from Vmagent as if we shutdown this vmstorage, we will get restore in ingestion, but when it’s back - we blocked.
** PPROF ** pprof.zip
To Reproduce don’t know to be honest
Expected behavior No Disk operation is blocking the ingestion of data
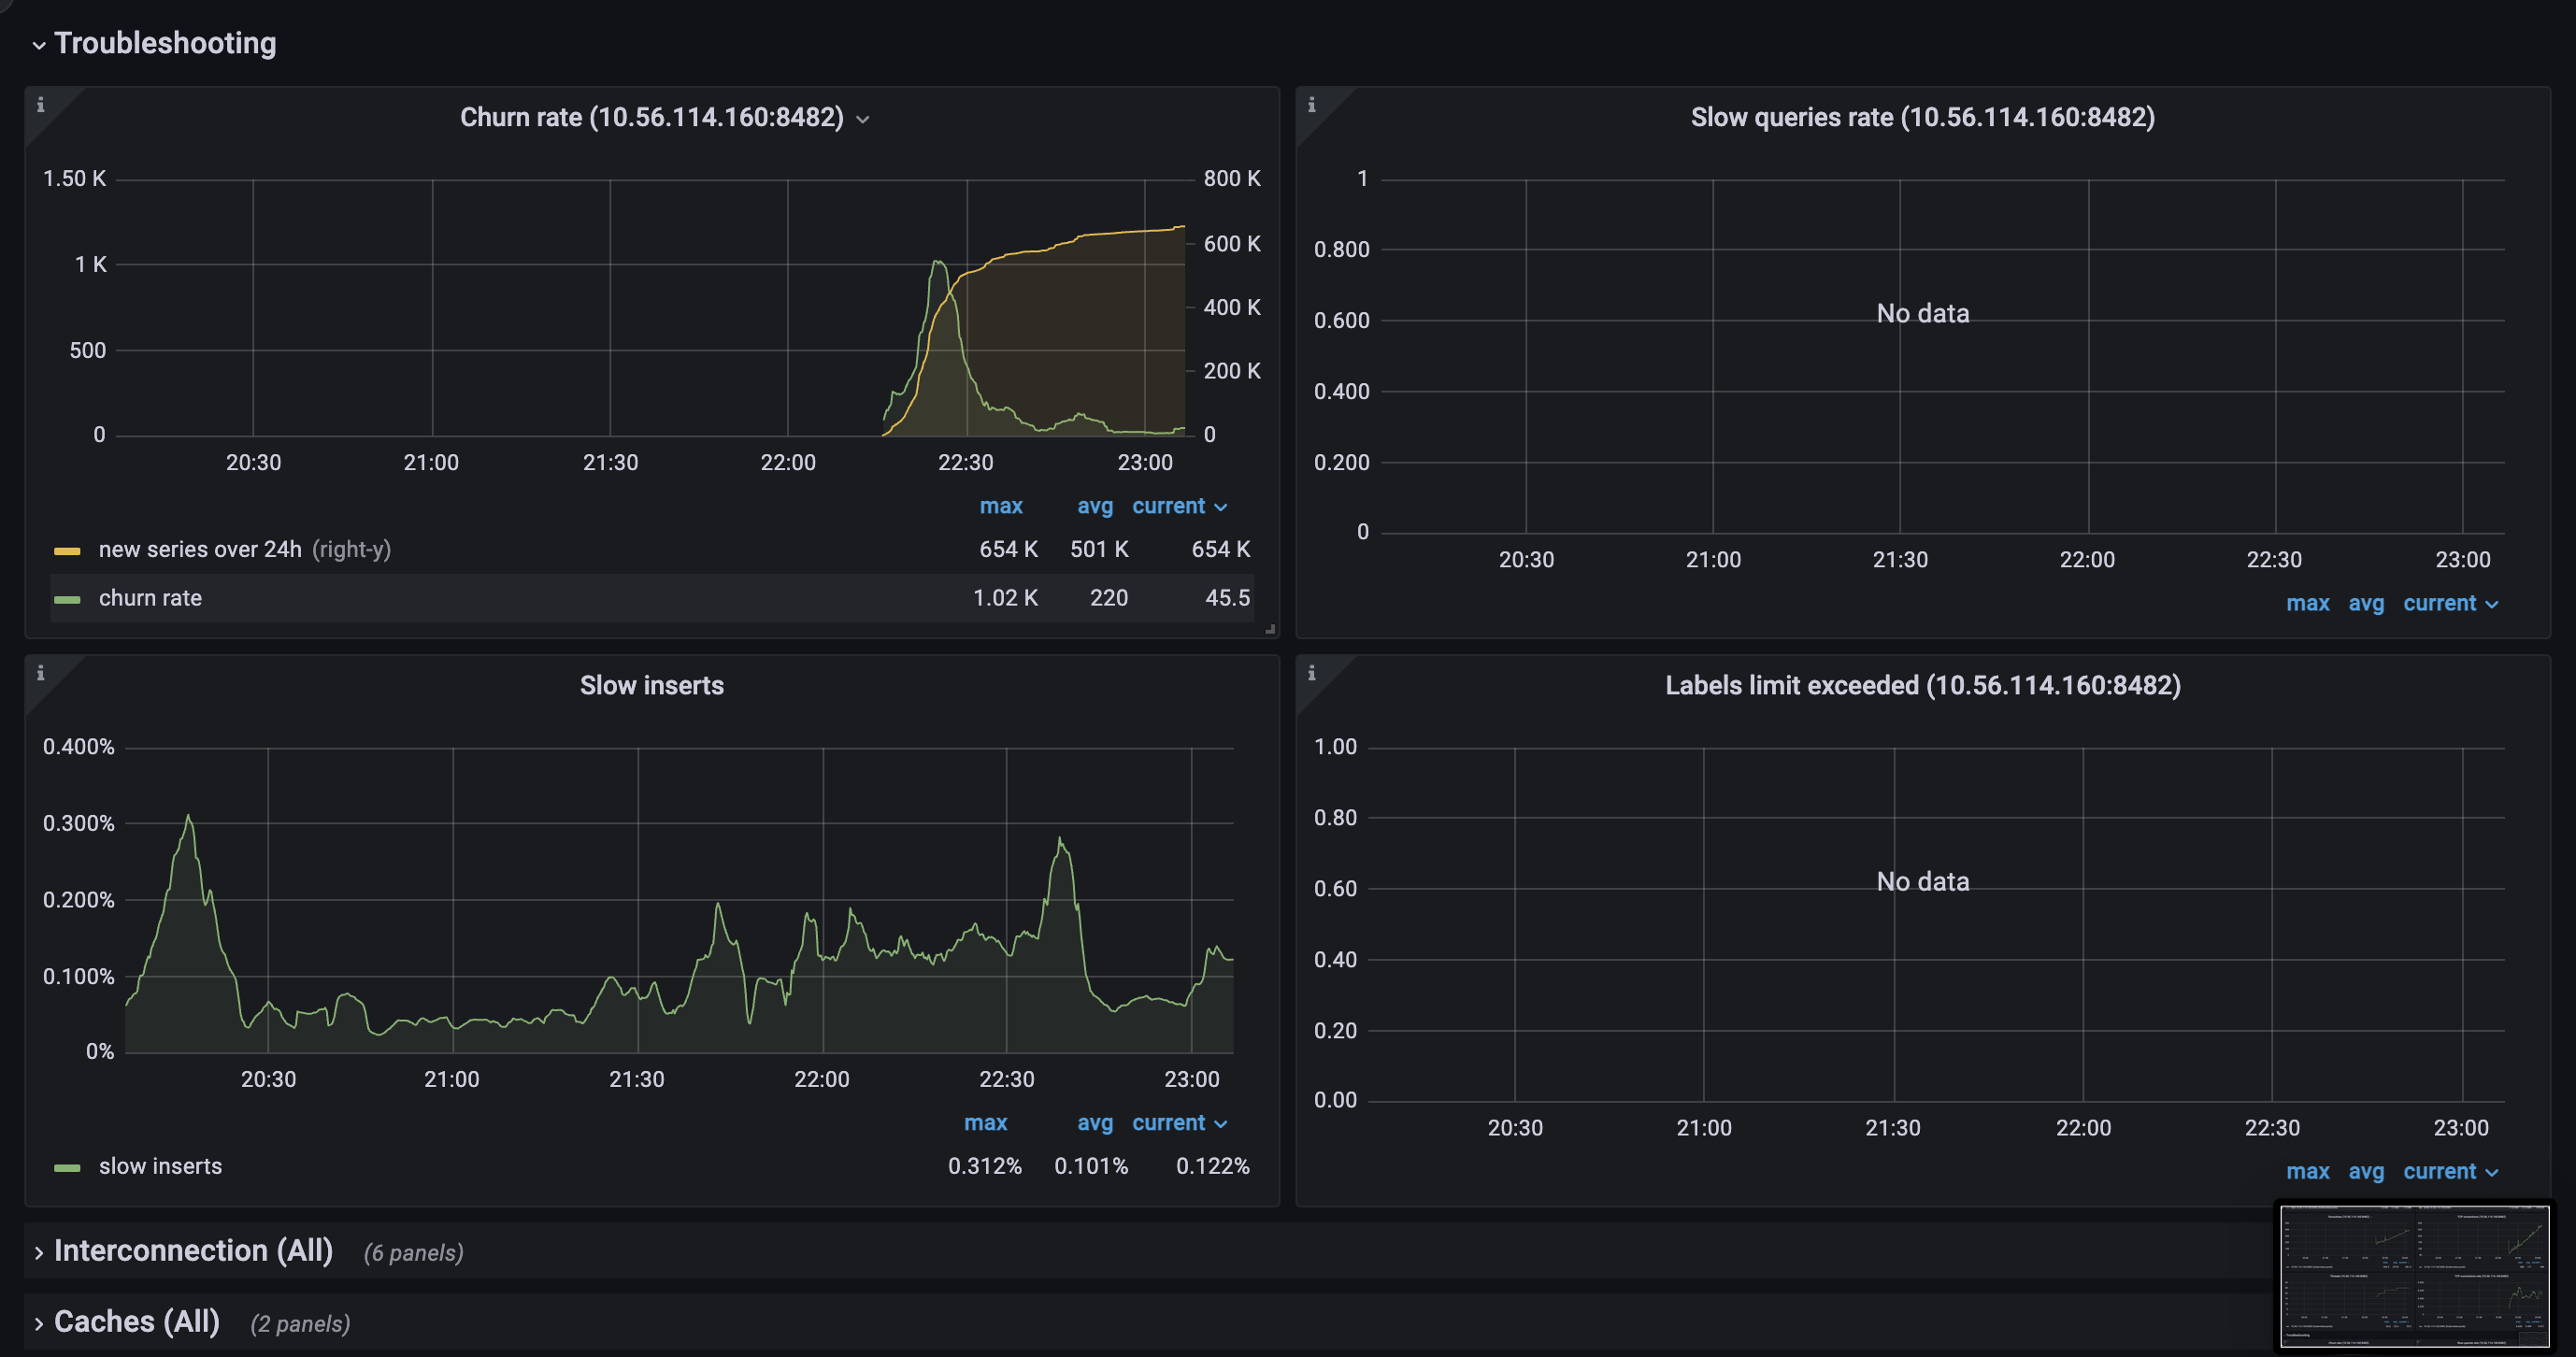
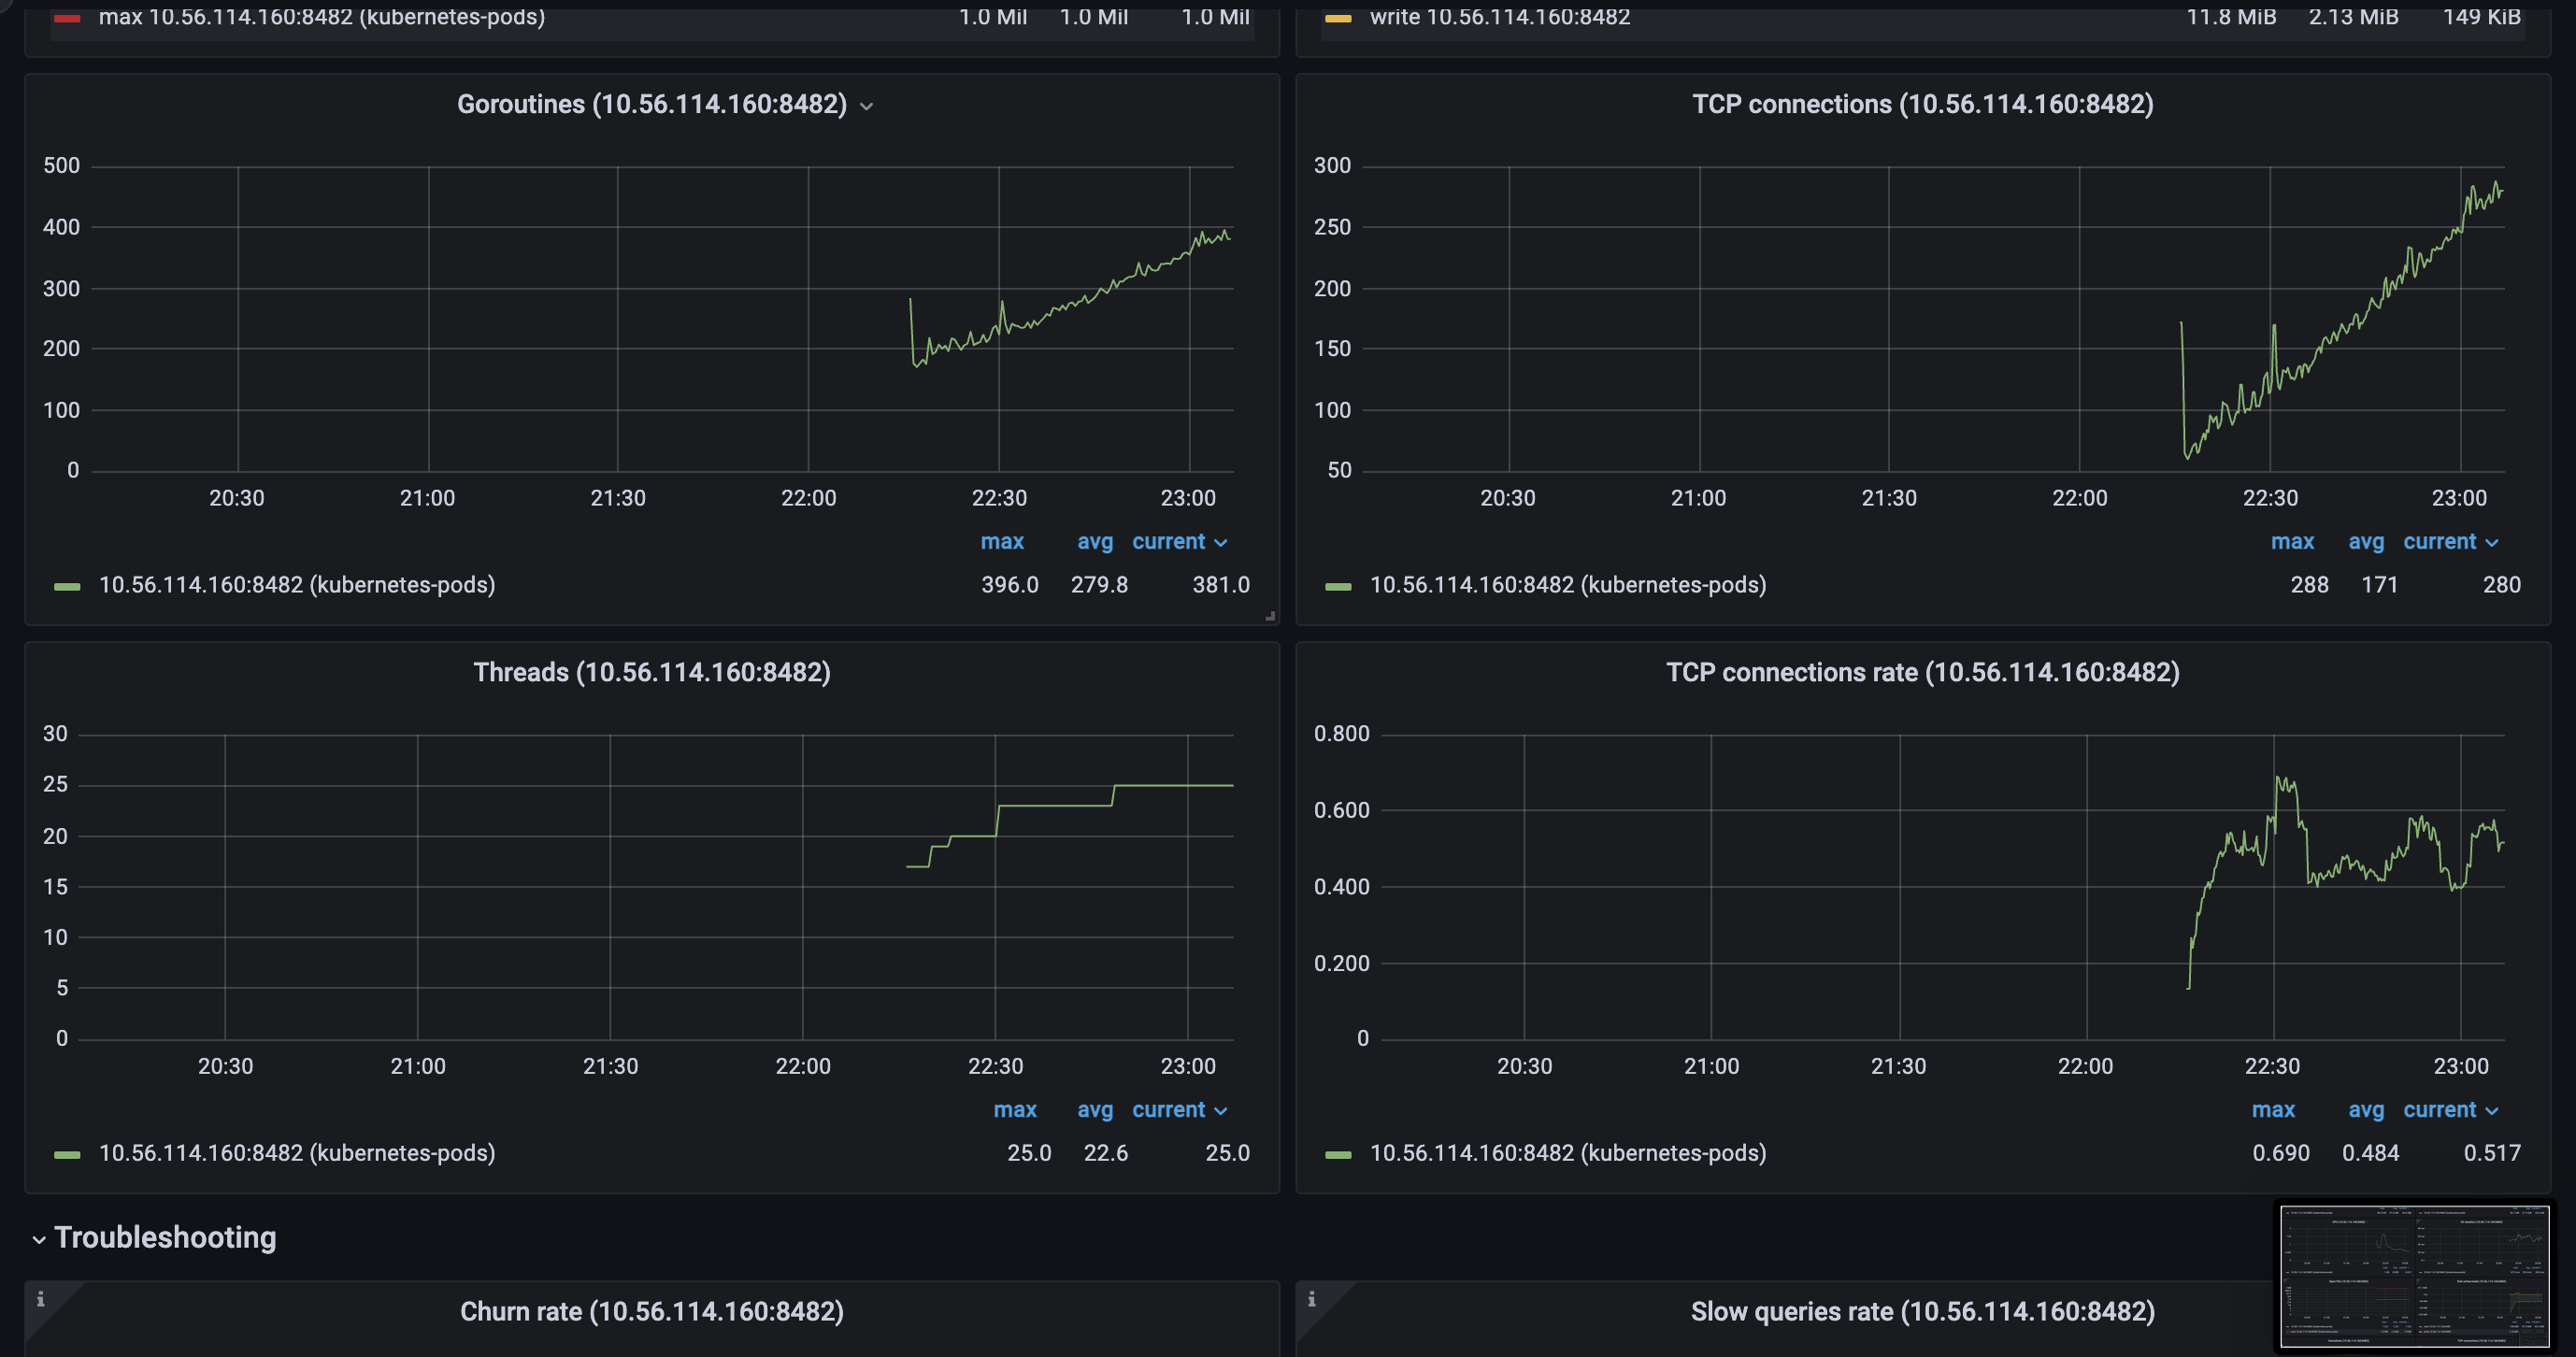
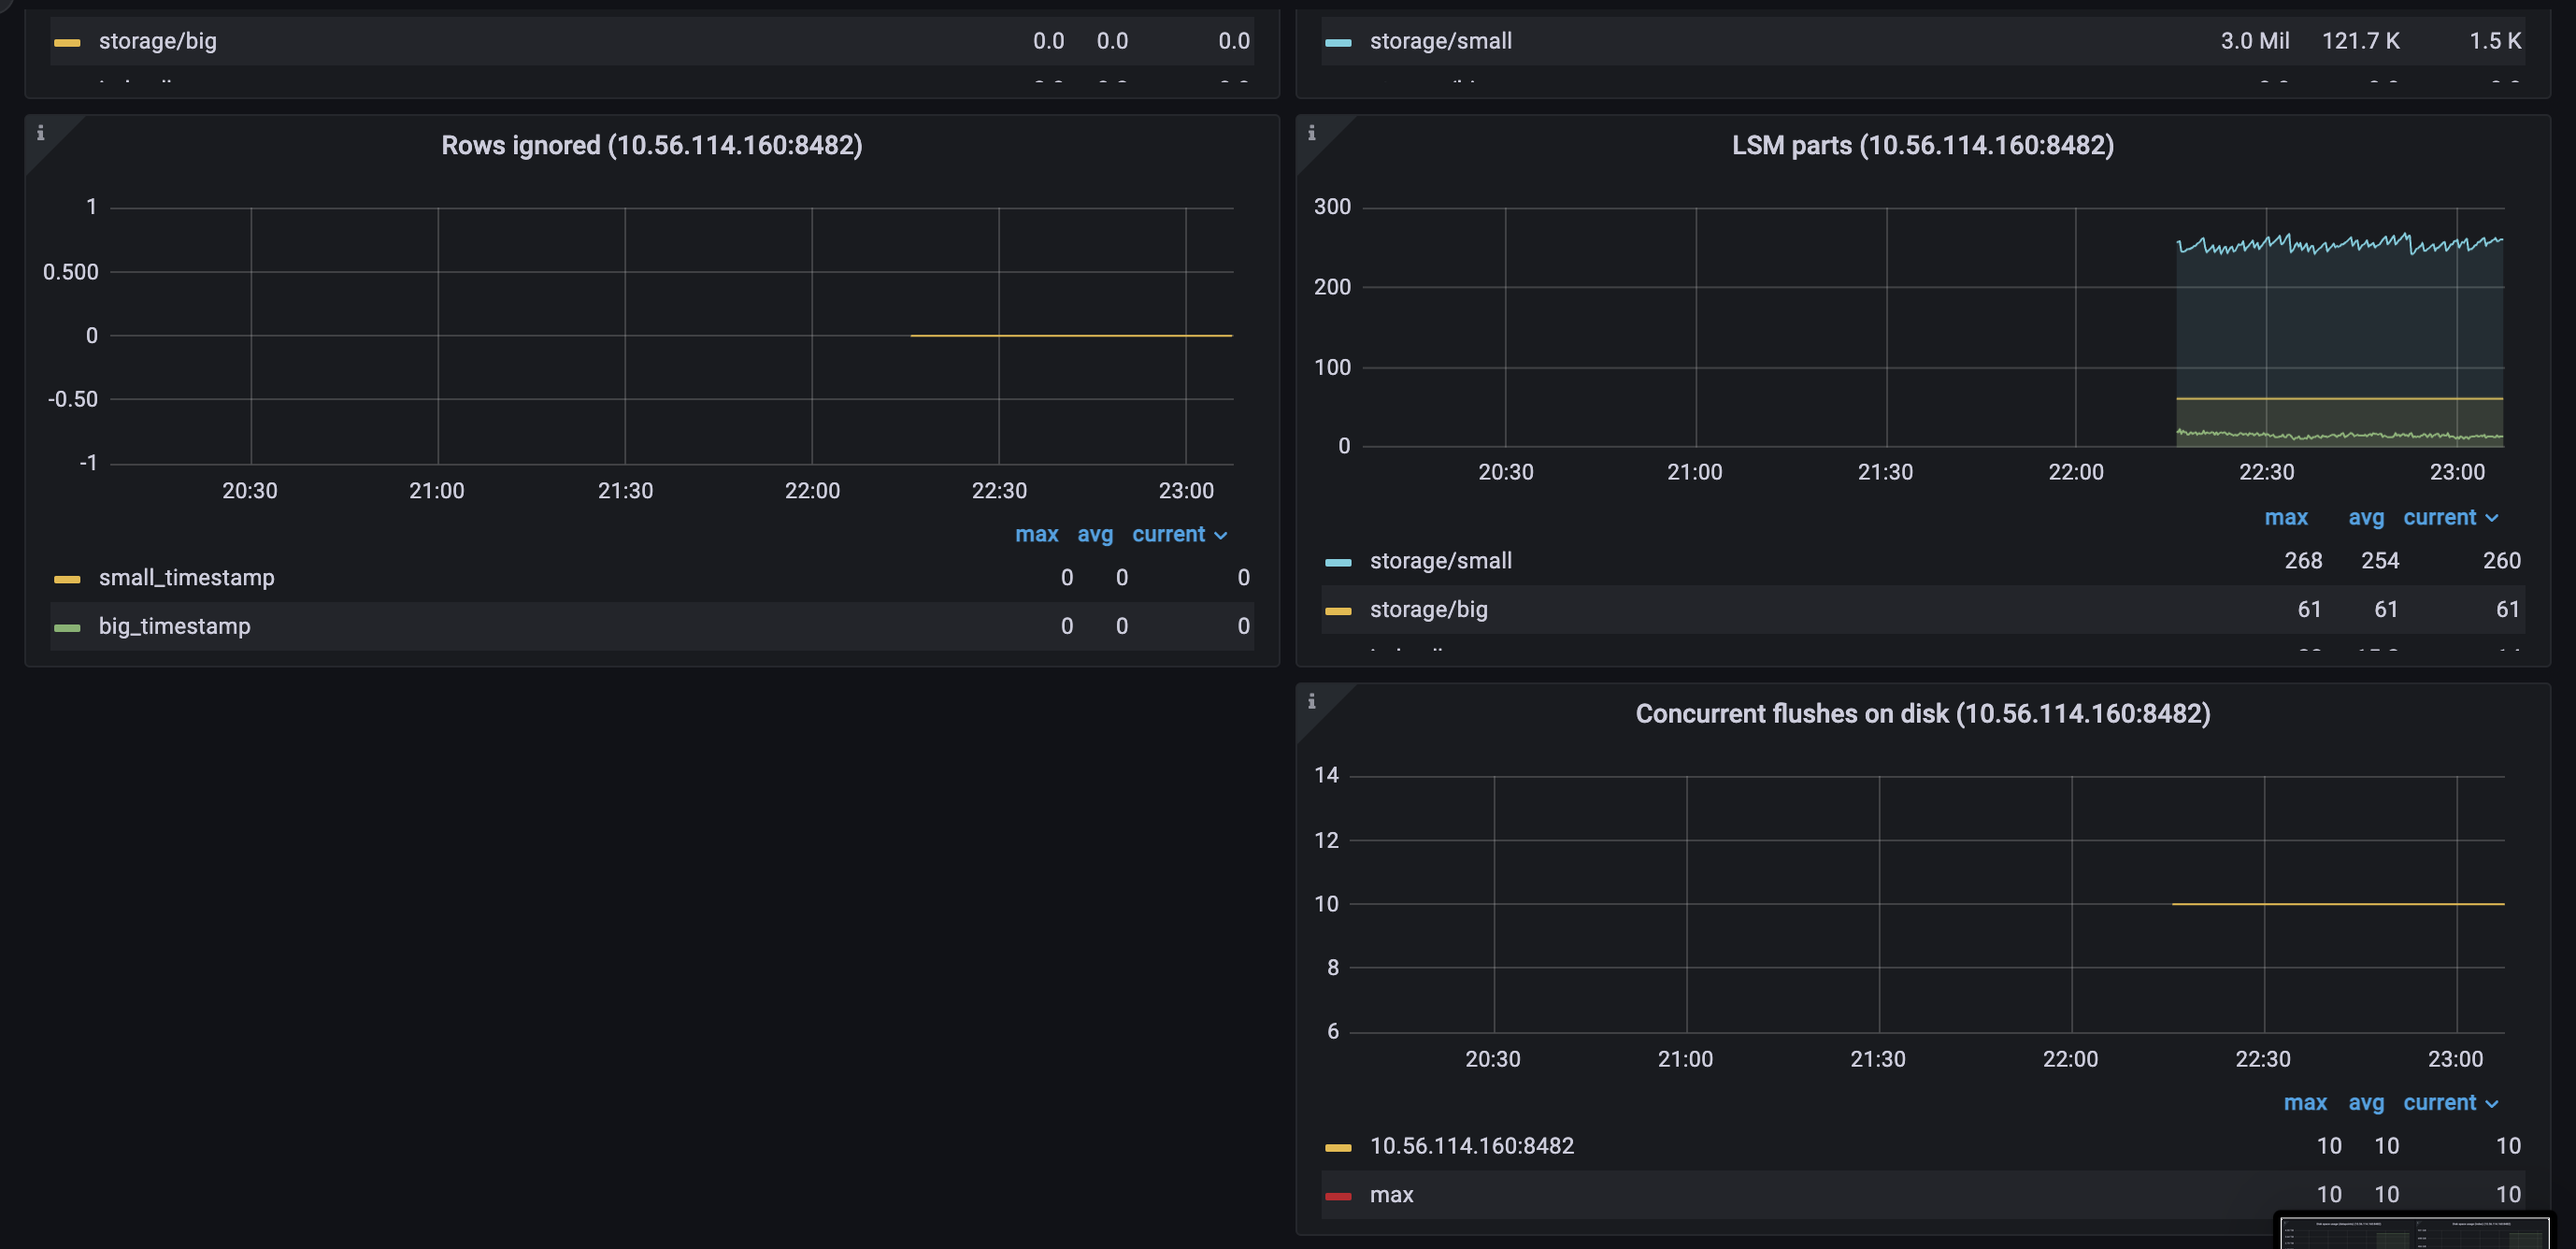
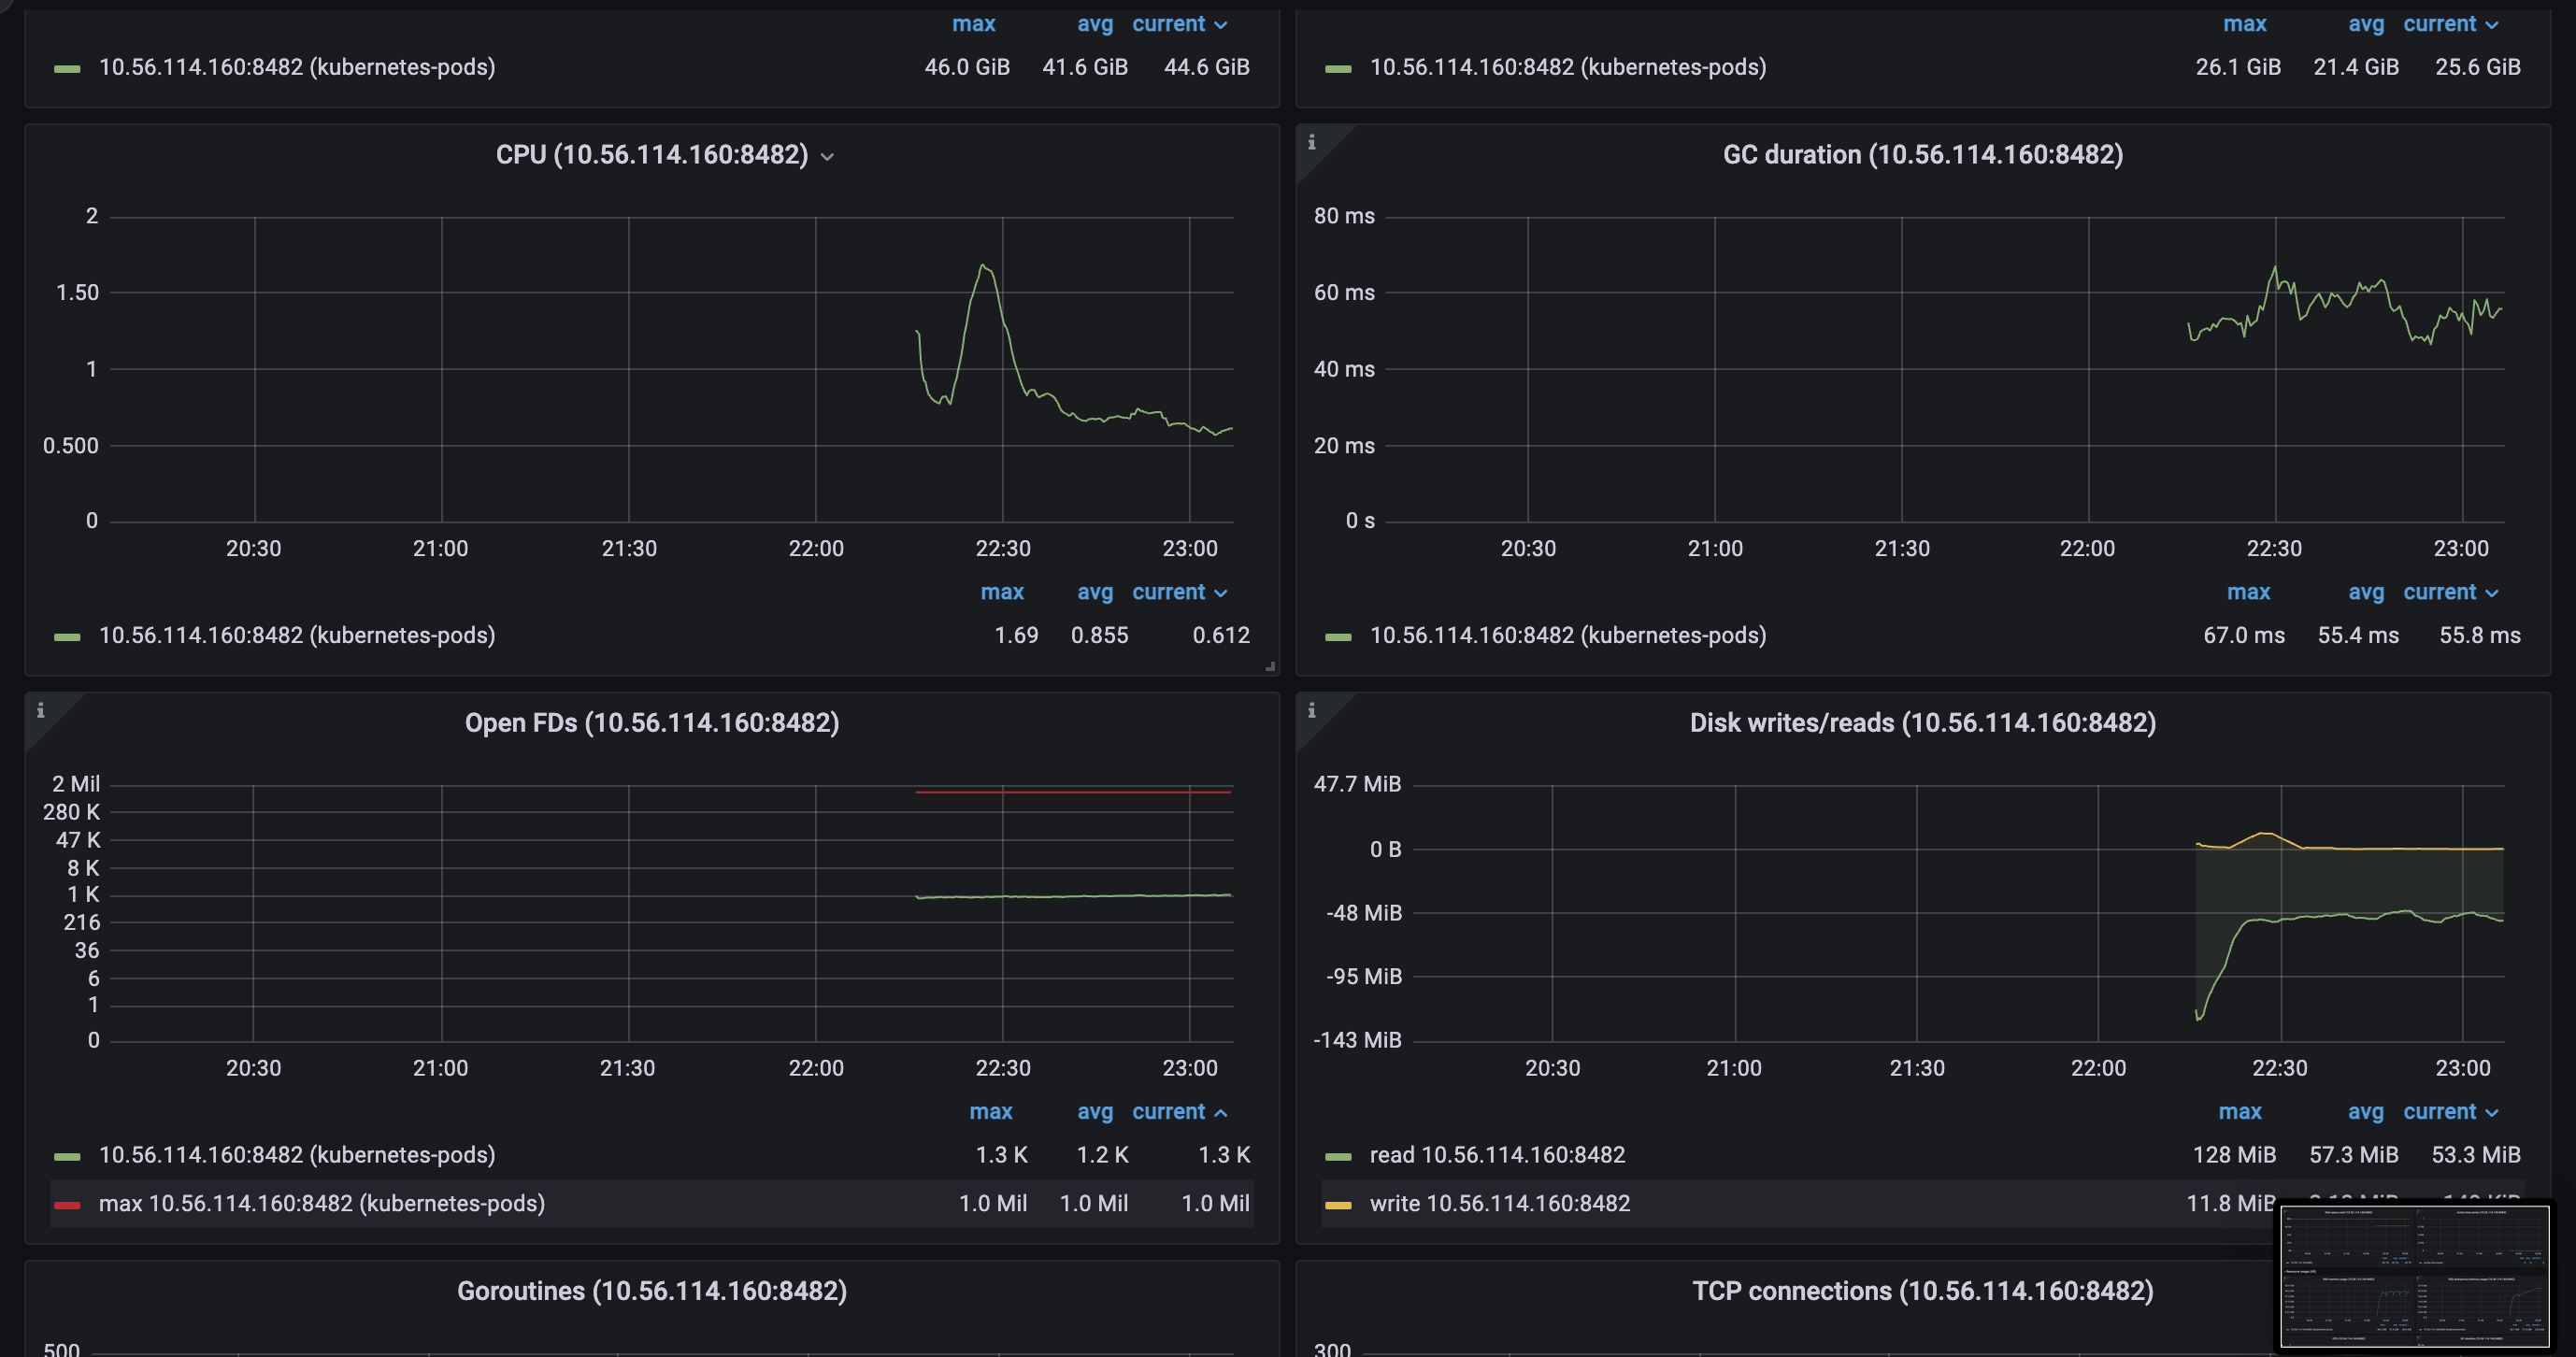
Screenshots


Version
/ # /vmstorage-prod --version
vmstorage-20220801-081914-tags-v1.79.1-cluster-0-g8b4726ed7
Used command-line flags
    Args:
      --retentionPeriod=6
      --storageDataPath=/storage
      --dedup.minScrapeInterval=15s
      --envflag.enable=true
      --envflag.prefix=VM_
      --http.maxGracefulShutdownDuration=10s
      --http.shutdownDelay=5s
      --loggerFormat=json
      --loggerLevel=INFO
      --loggerOutput=stdout
      --memory.allowedPercent=60
      --search.maxUniqueTimeseries=10000000
About this issue
- Original URL
- State: closed
- Created 2 years ago
- Comments: 16
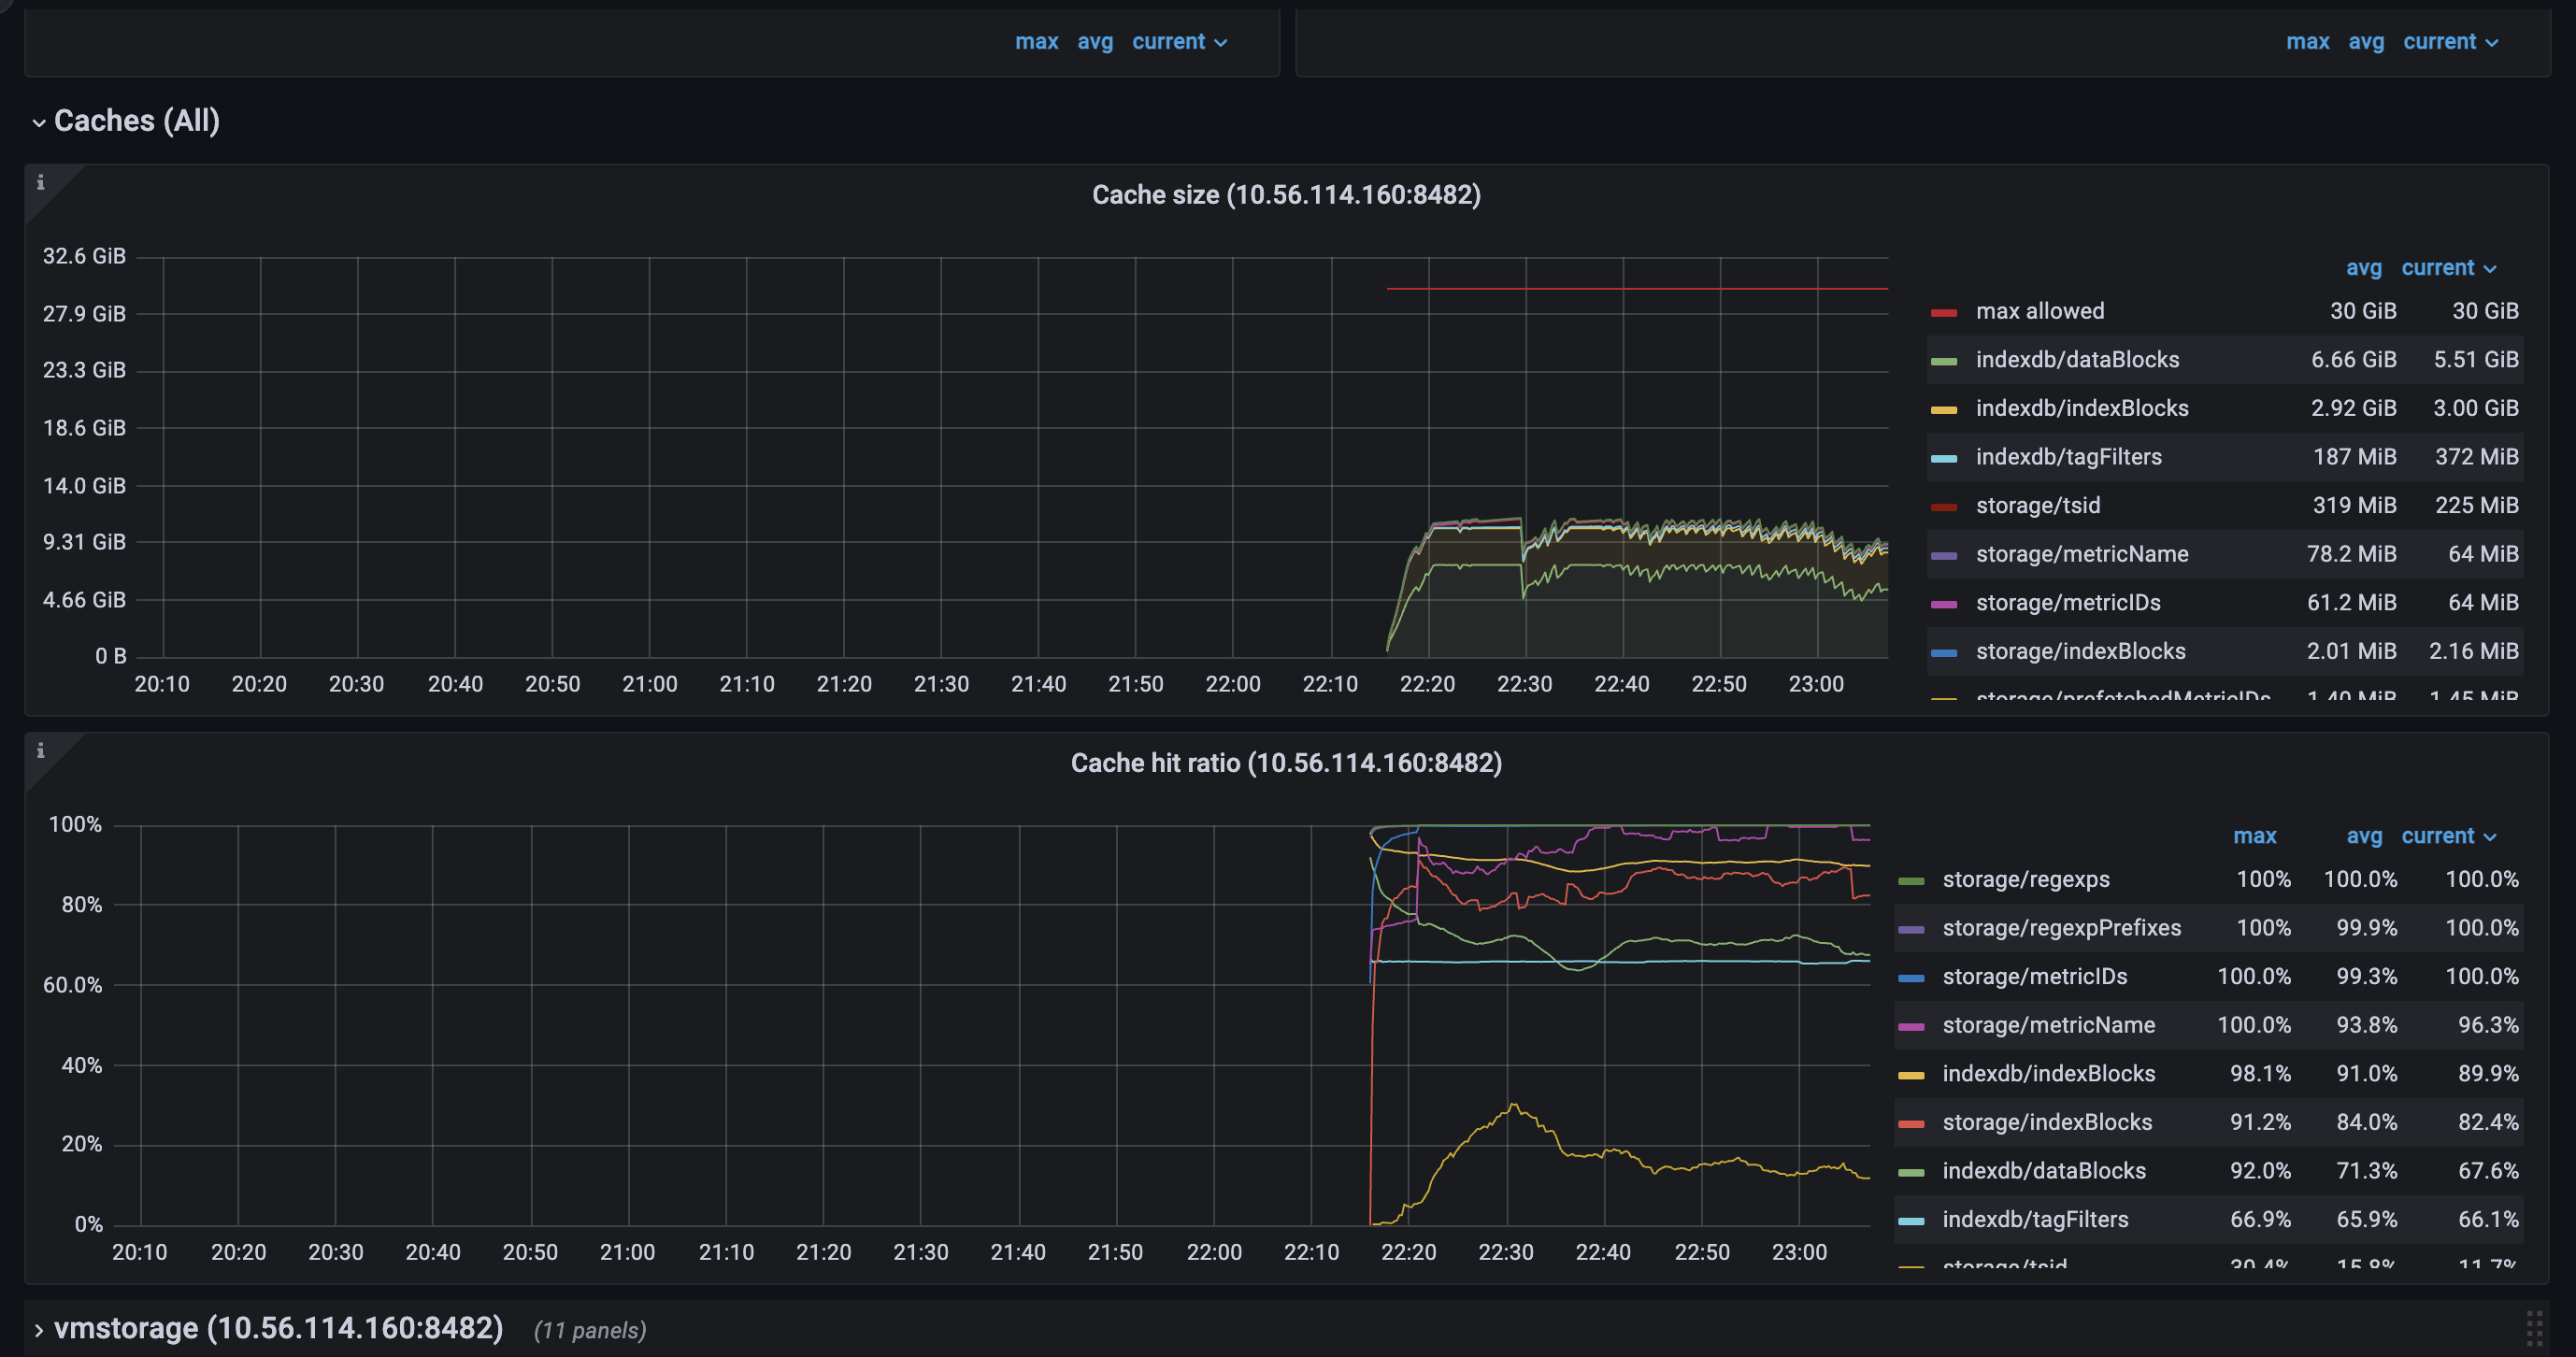
Cache structure in VictoriaMetrics works in different modes. One of the modes (picked mode depends on amount of occupied memory by the entries in cache) works in a split fashion, where the cache entries are split into two parts: current and previous. These parts interchange each other ones current part is already full. The split mode may be enabled on the cache load if all dedicated space to the cache was already occupied. So on load time the oldest cache part may be evicted. Another detail is that entries eviction from caches happens each 5min or on the first load time. It is likely that some entries were evicted on the load time as well.
Please see prev response. More details about cache structure can be found here https://github.com/VictoriaMetrics/VictoriaMetrics/blob/master/lib/workingsetcache/cache.go
Please find detailed explanation here https://github.com/VictoriaMetrics/VictoriaMetrics/issues/2007#issuecomment-1032080840
There is no way, so far, except manual migration. And that won’t help as well, since you’ll need to have different retentions on storage nodes to do that. Delete API is also not recommended to use in this case, since it doesn’t actually delete the data, only marks it as so.
But still, adding new shards would improve the overall performance of the cluster. If you read carefully this comment you’ll see that cache lookups may be improved by extending capacity of
indexdb/dataBlockscache. This can be done either by increasing available memory (to the process or to this specific cache) or by adding more shards to the cluster.alright, I have some thoughts to share and also some questions regarding cache of
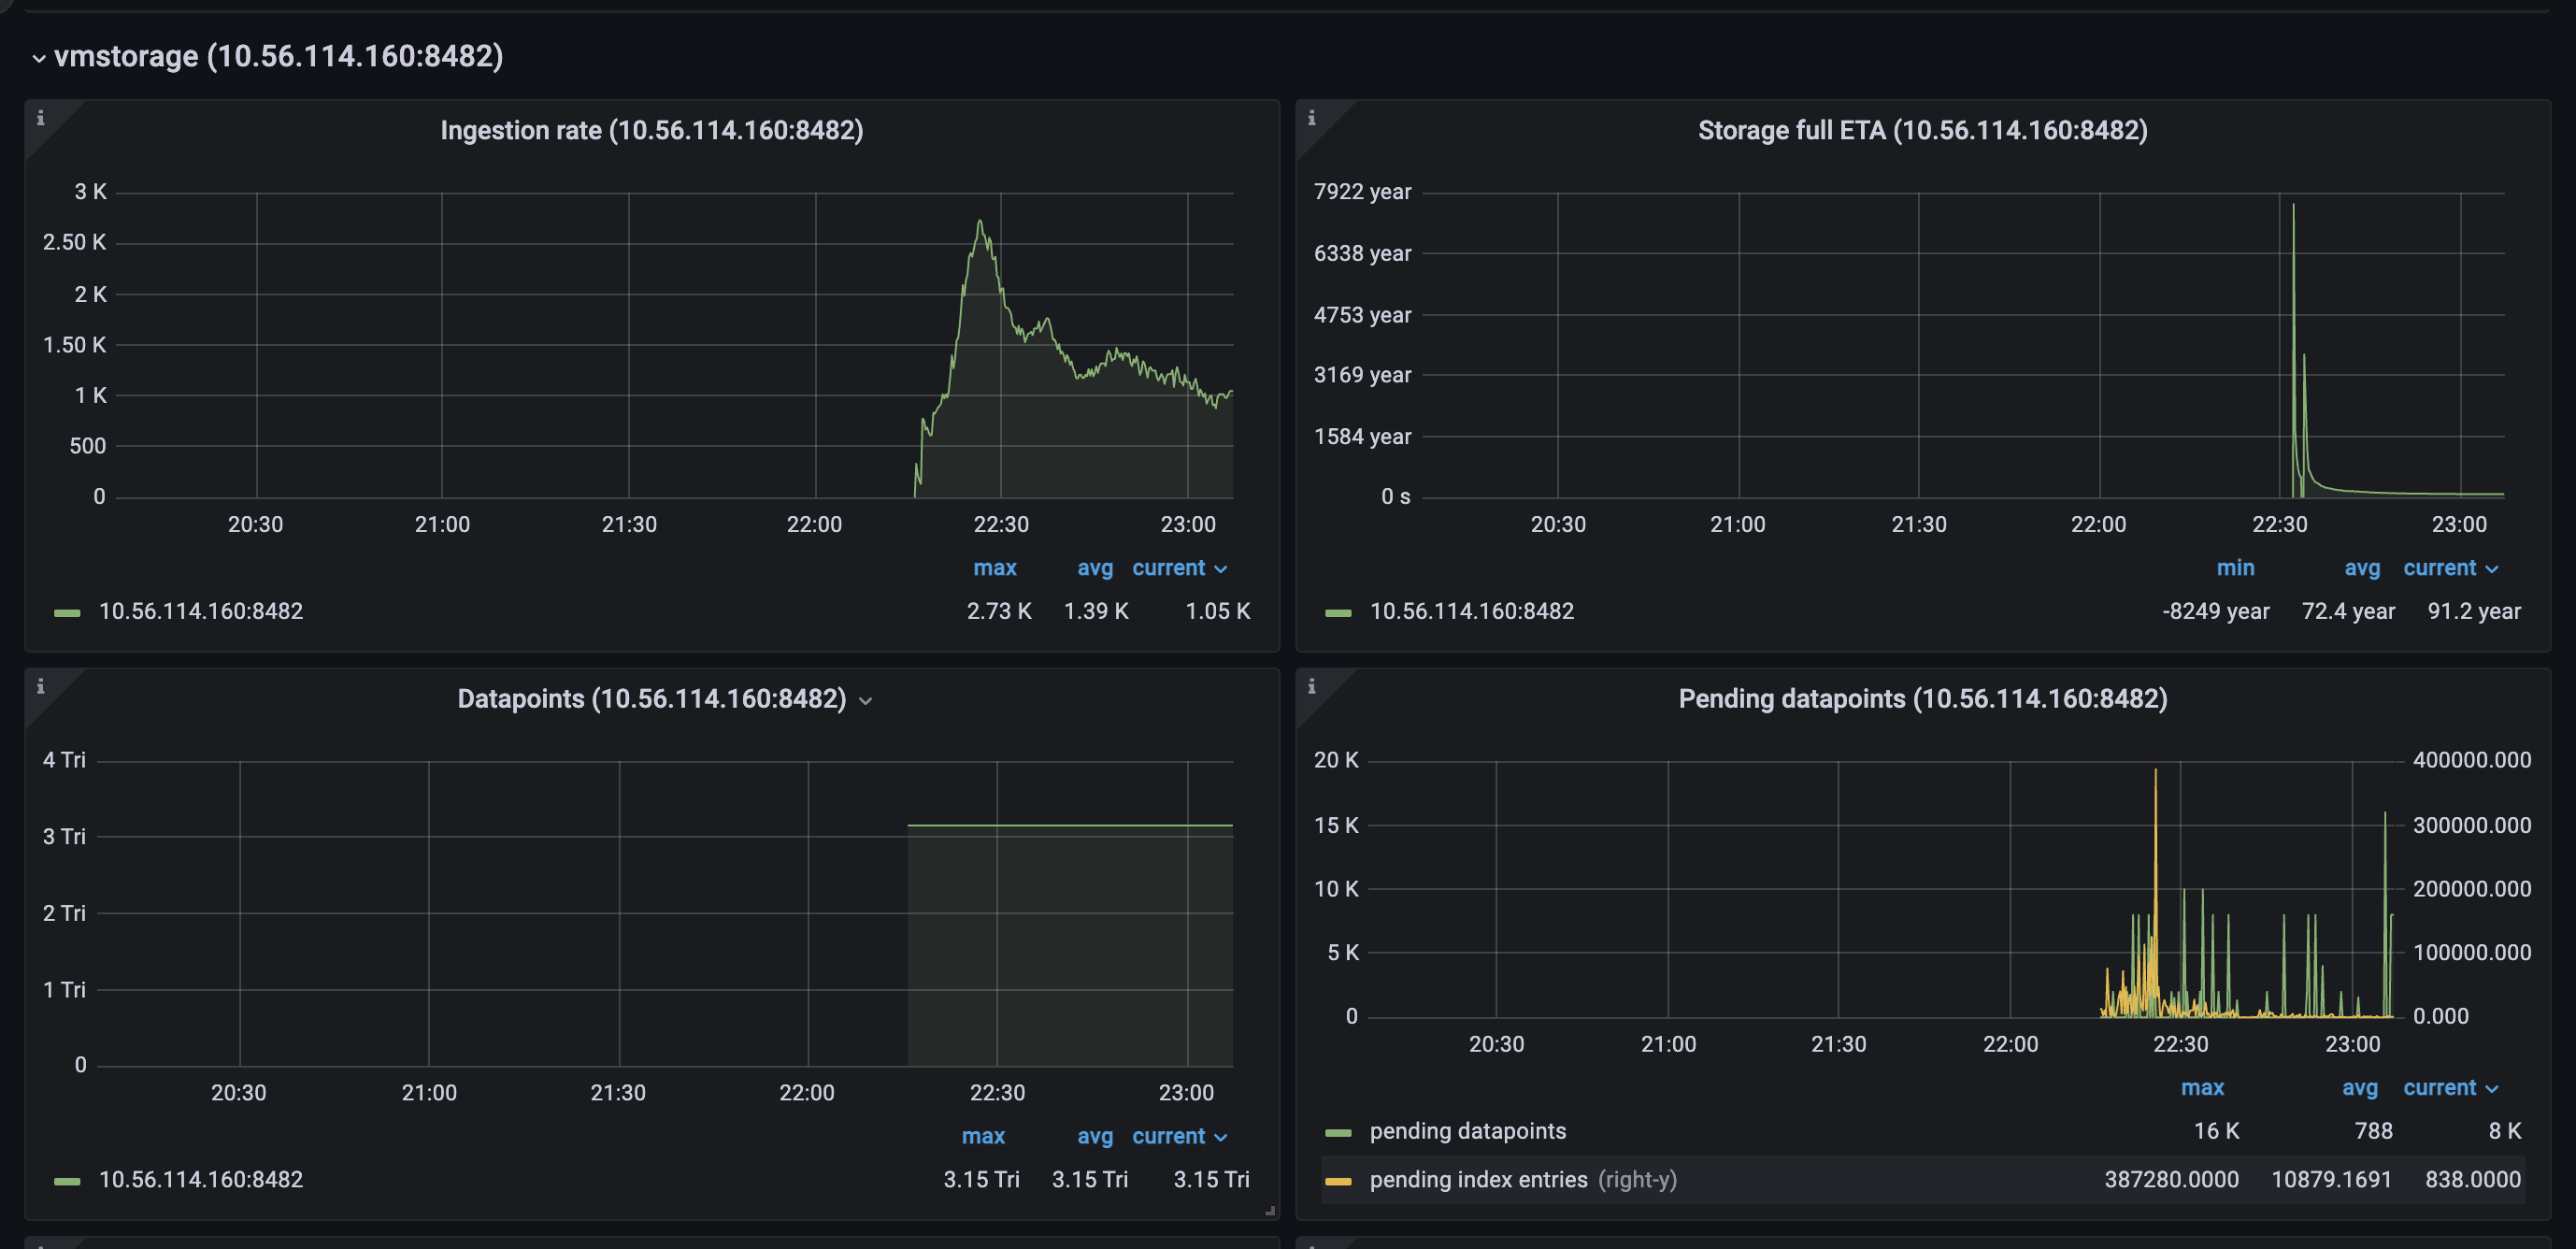
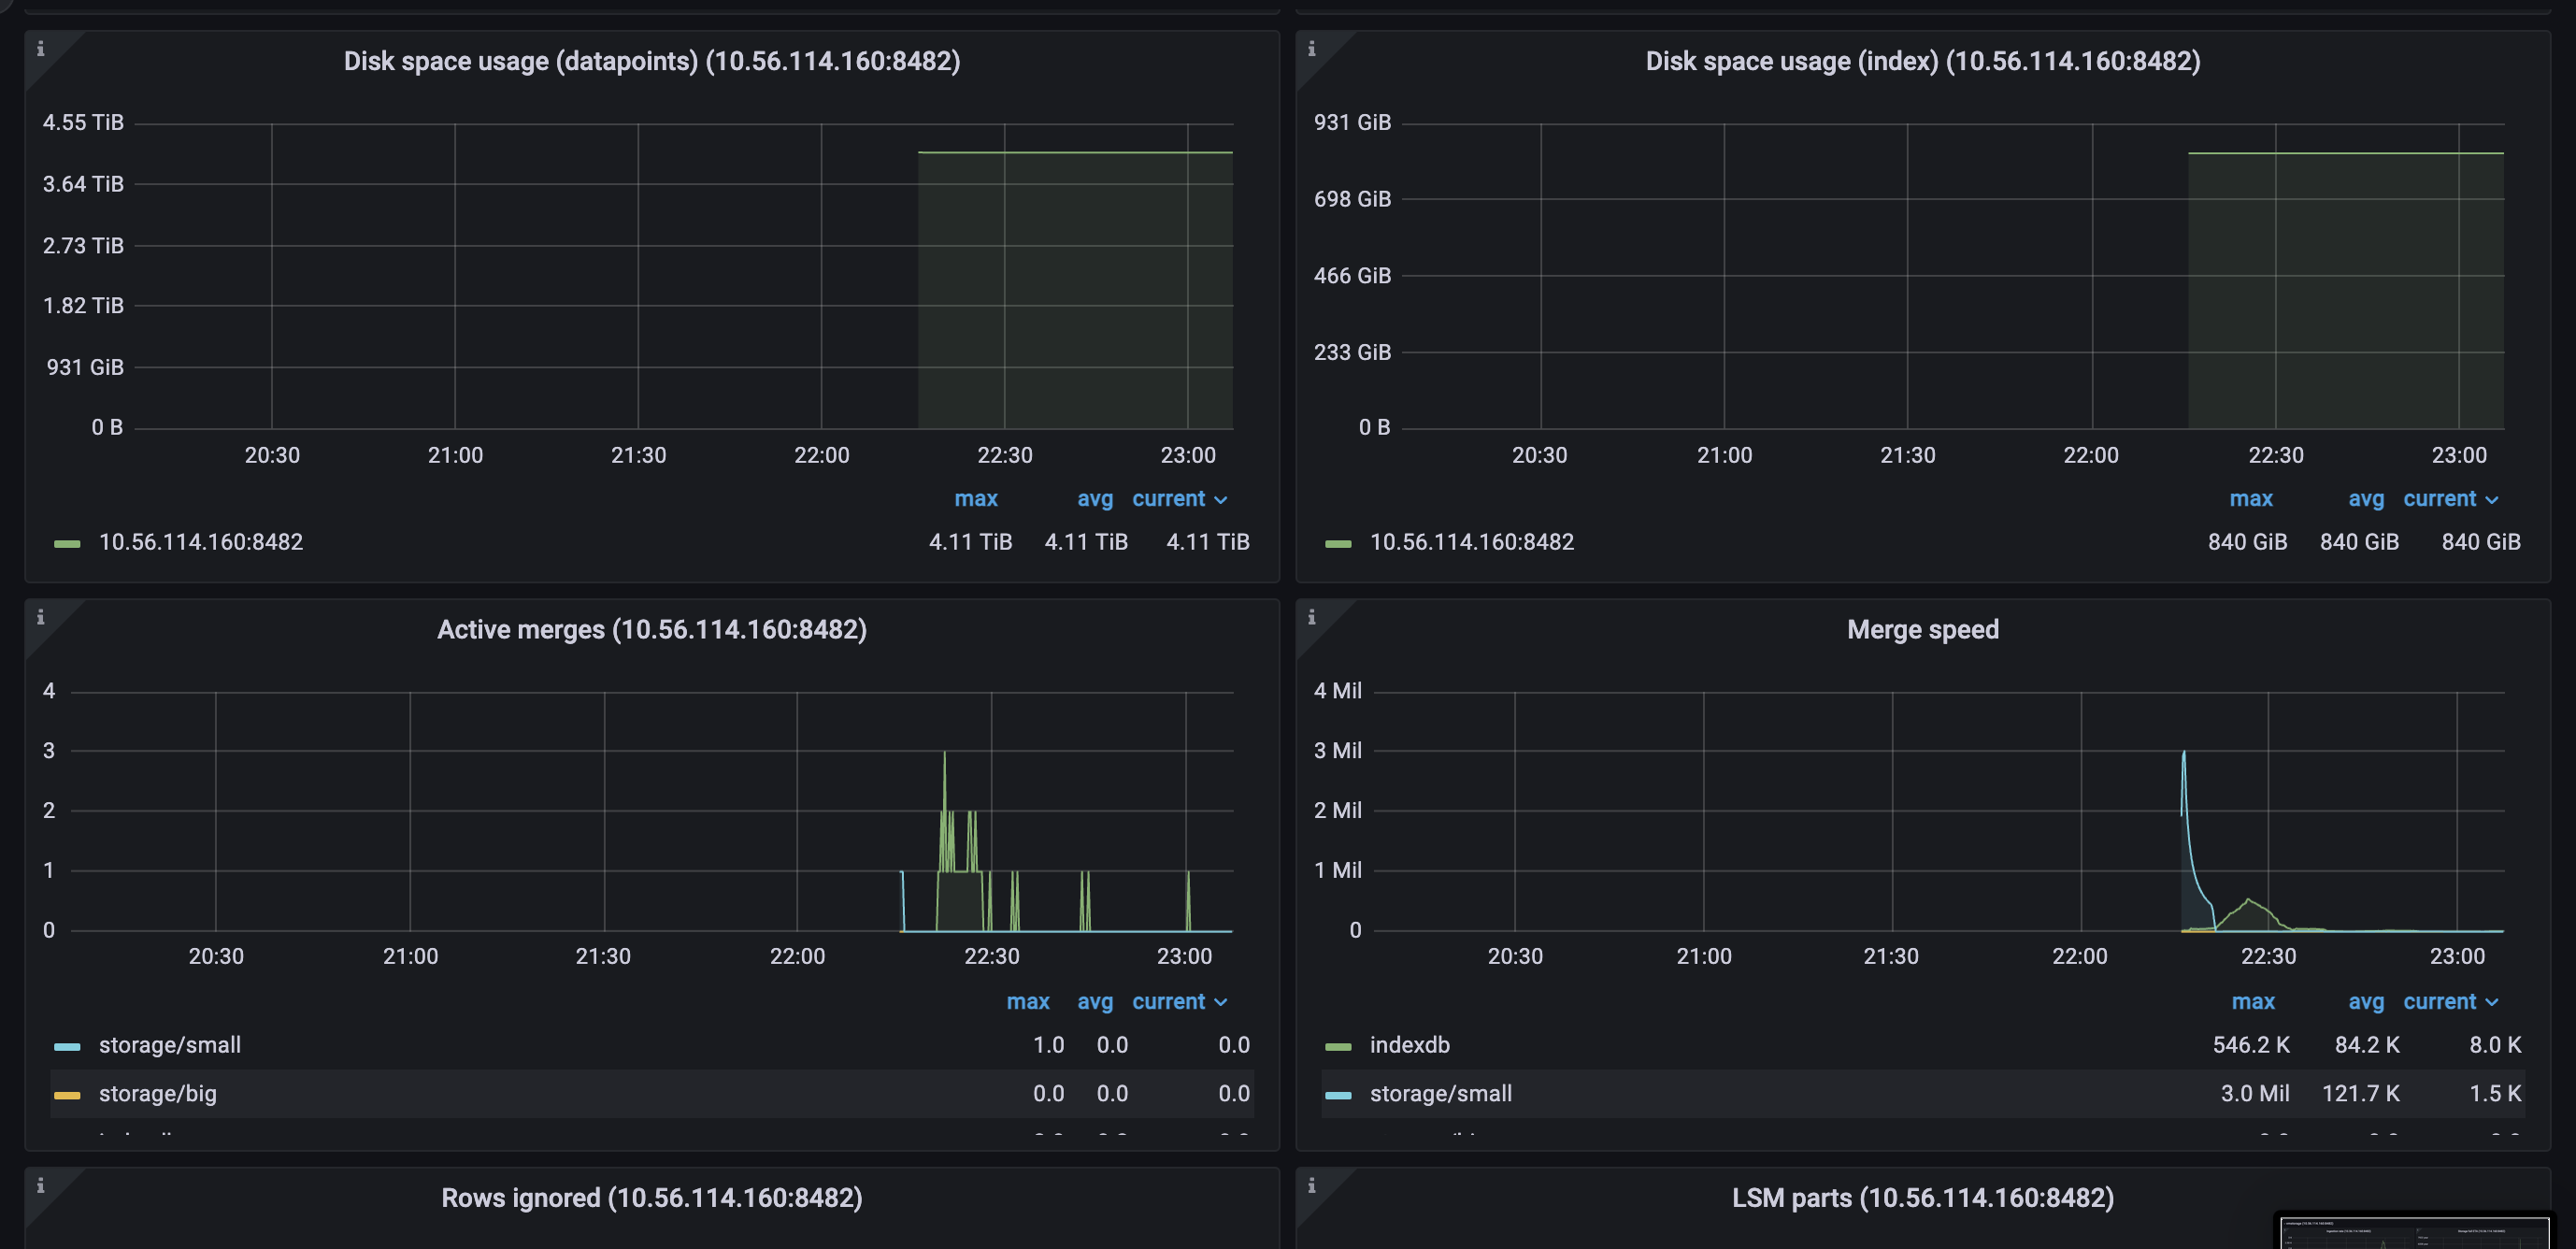
vmstorage.vmstoragenodes bound to IO on reads from the filesystem, which we can clearly see on the screenshots above.TSIDcache (which can be the bottle neck with the high churn rate or in the case of rerouting ) because from my understandingTSIDis the cache to look before registering new metric in the storage. This part is clear.For here, I have several questions regarding TSID cache:
1. TSID cache size on restart
If I restart one pod of
vmstorageI can see following picture: save cache:restoring cache
as you can see, size of the cache is different on persisting and restoring phases, basically, it’s 2 times fewer on restore. Is that mean that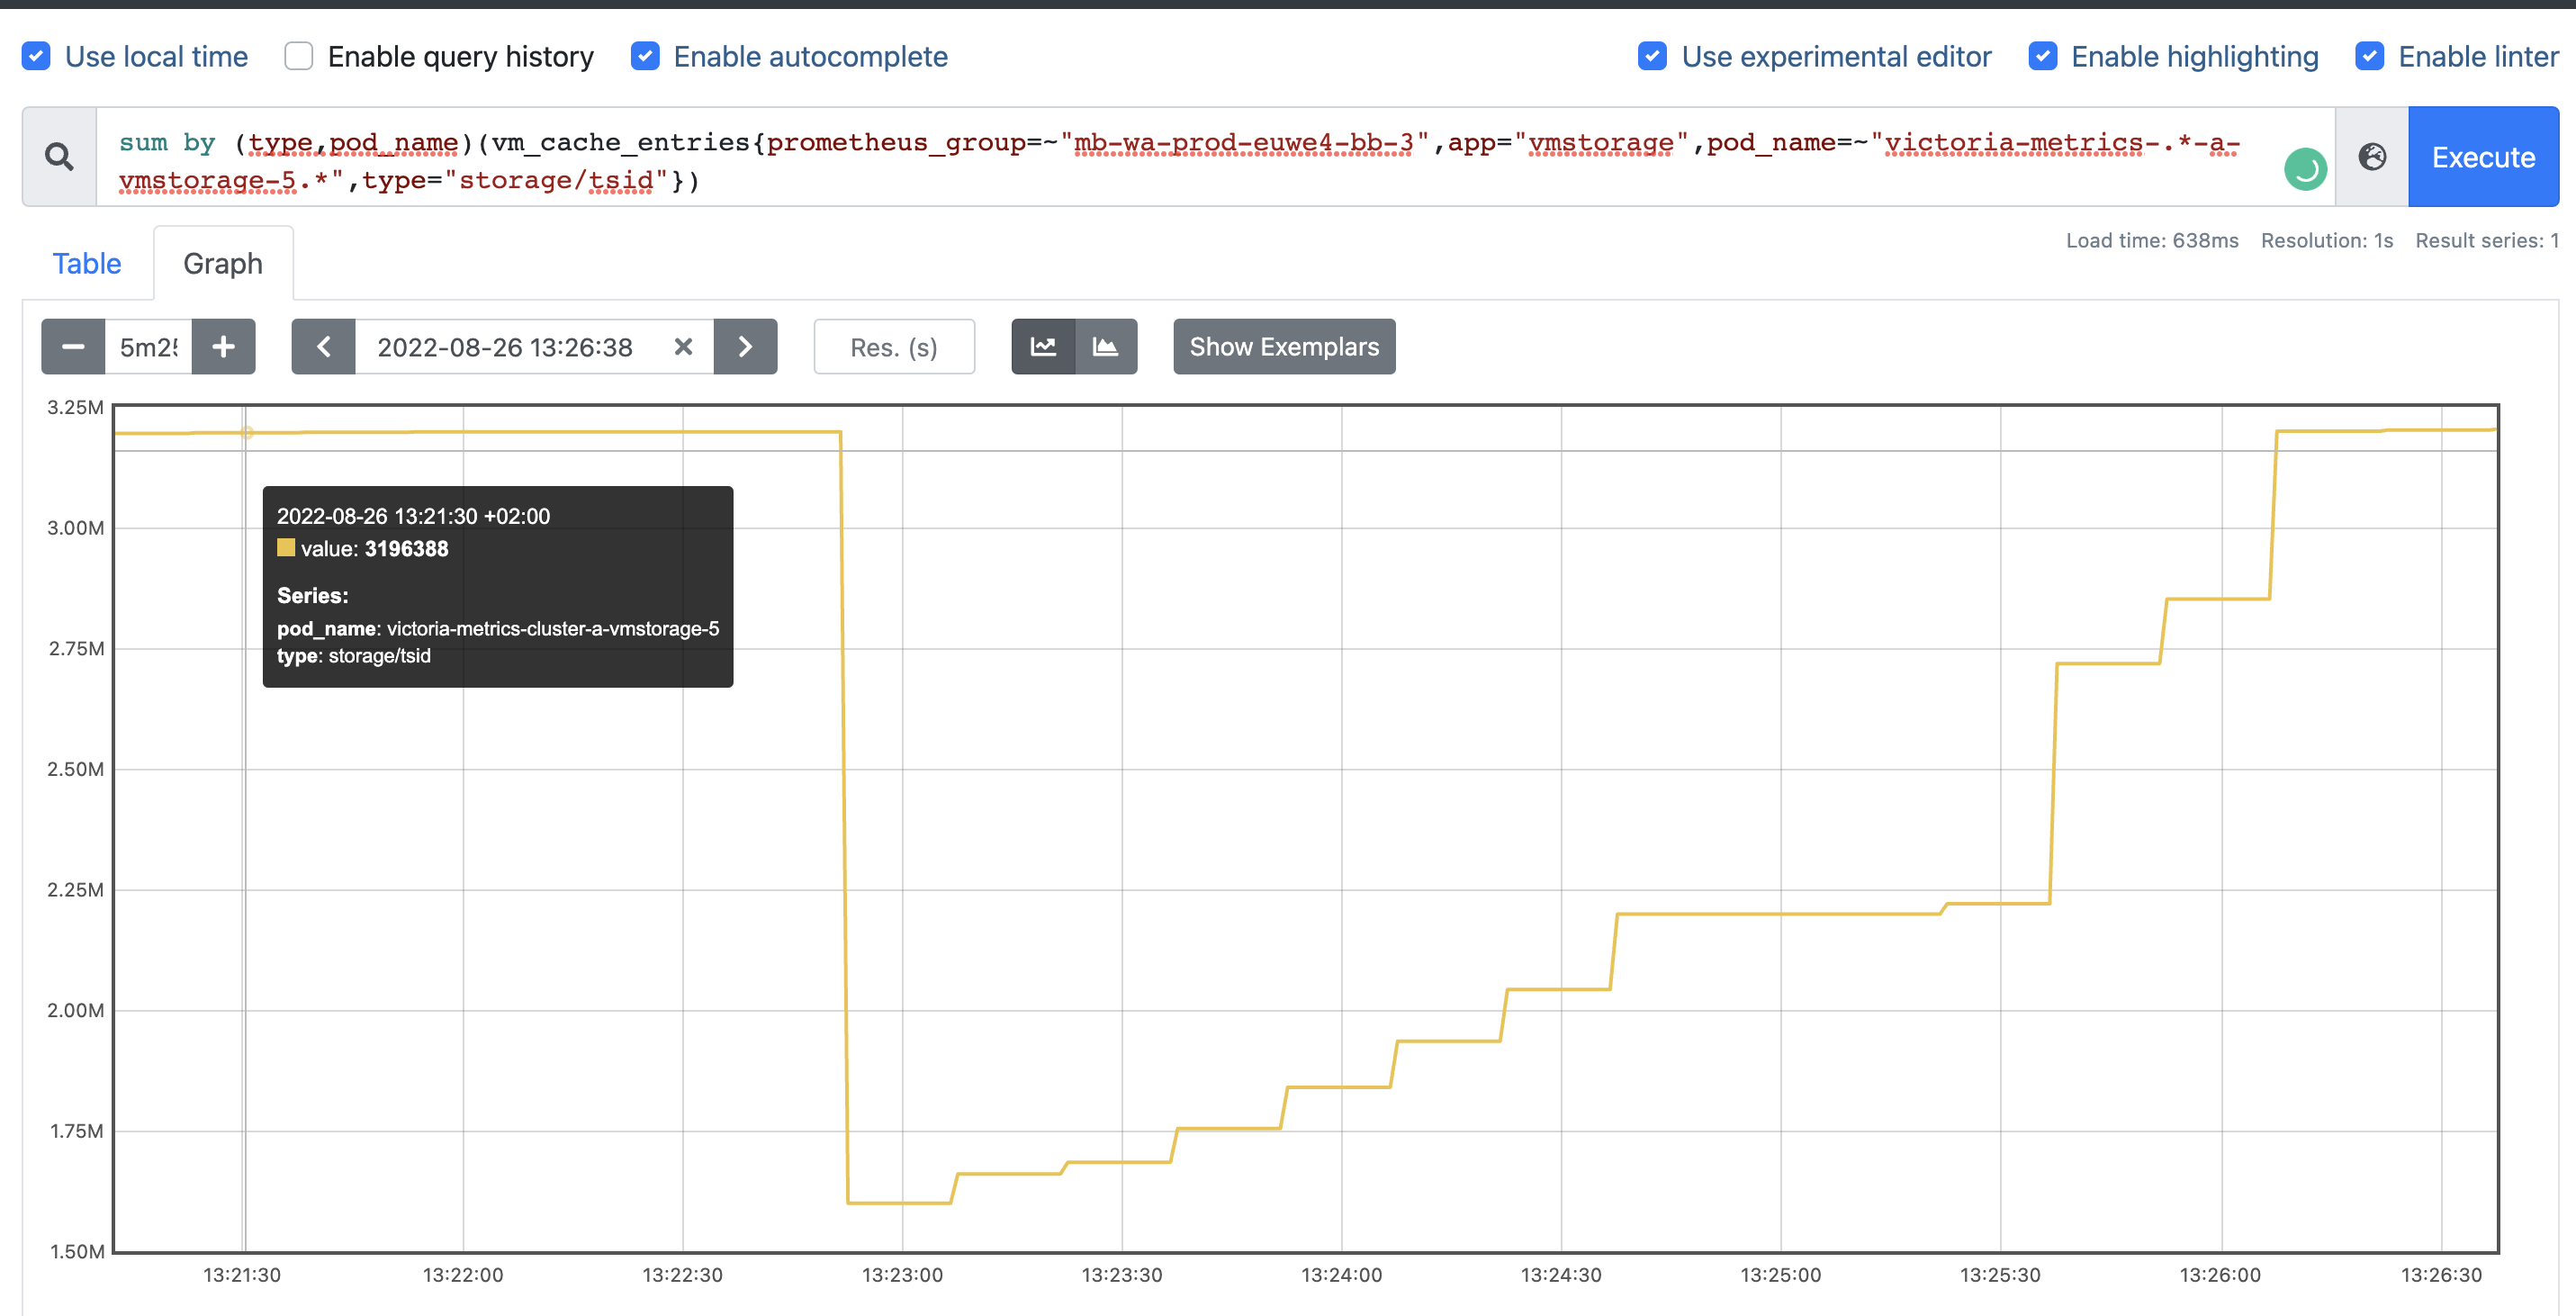 so, it’s saving
vmstoragedoes not restore the whole cache? or it’s just the wrong metadata? the same picture I can get from the metrics:3 milentries but restoring only half.Another unclear moment is regarding metric and type
vm_cache_size_bytes{type="storage/tsid"}, seems like it matches by amount of entries/storage/cache/metricName_tsidfolder, but what metric covers/storage/cache/metricID_tsidthan?2. TSID cache utilization and resets
Is there a cache reset every 5 minutes?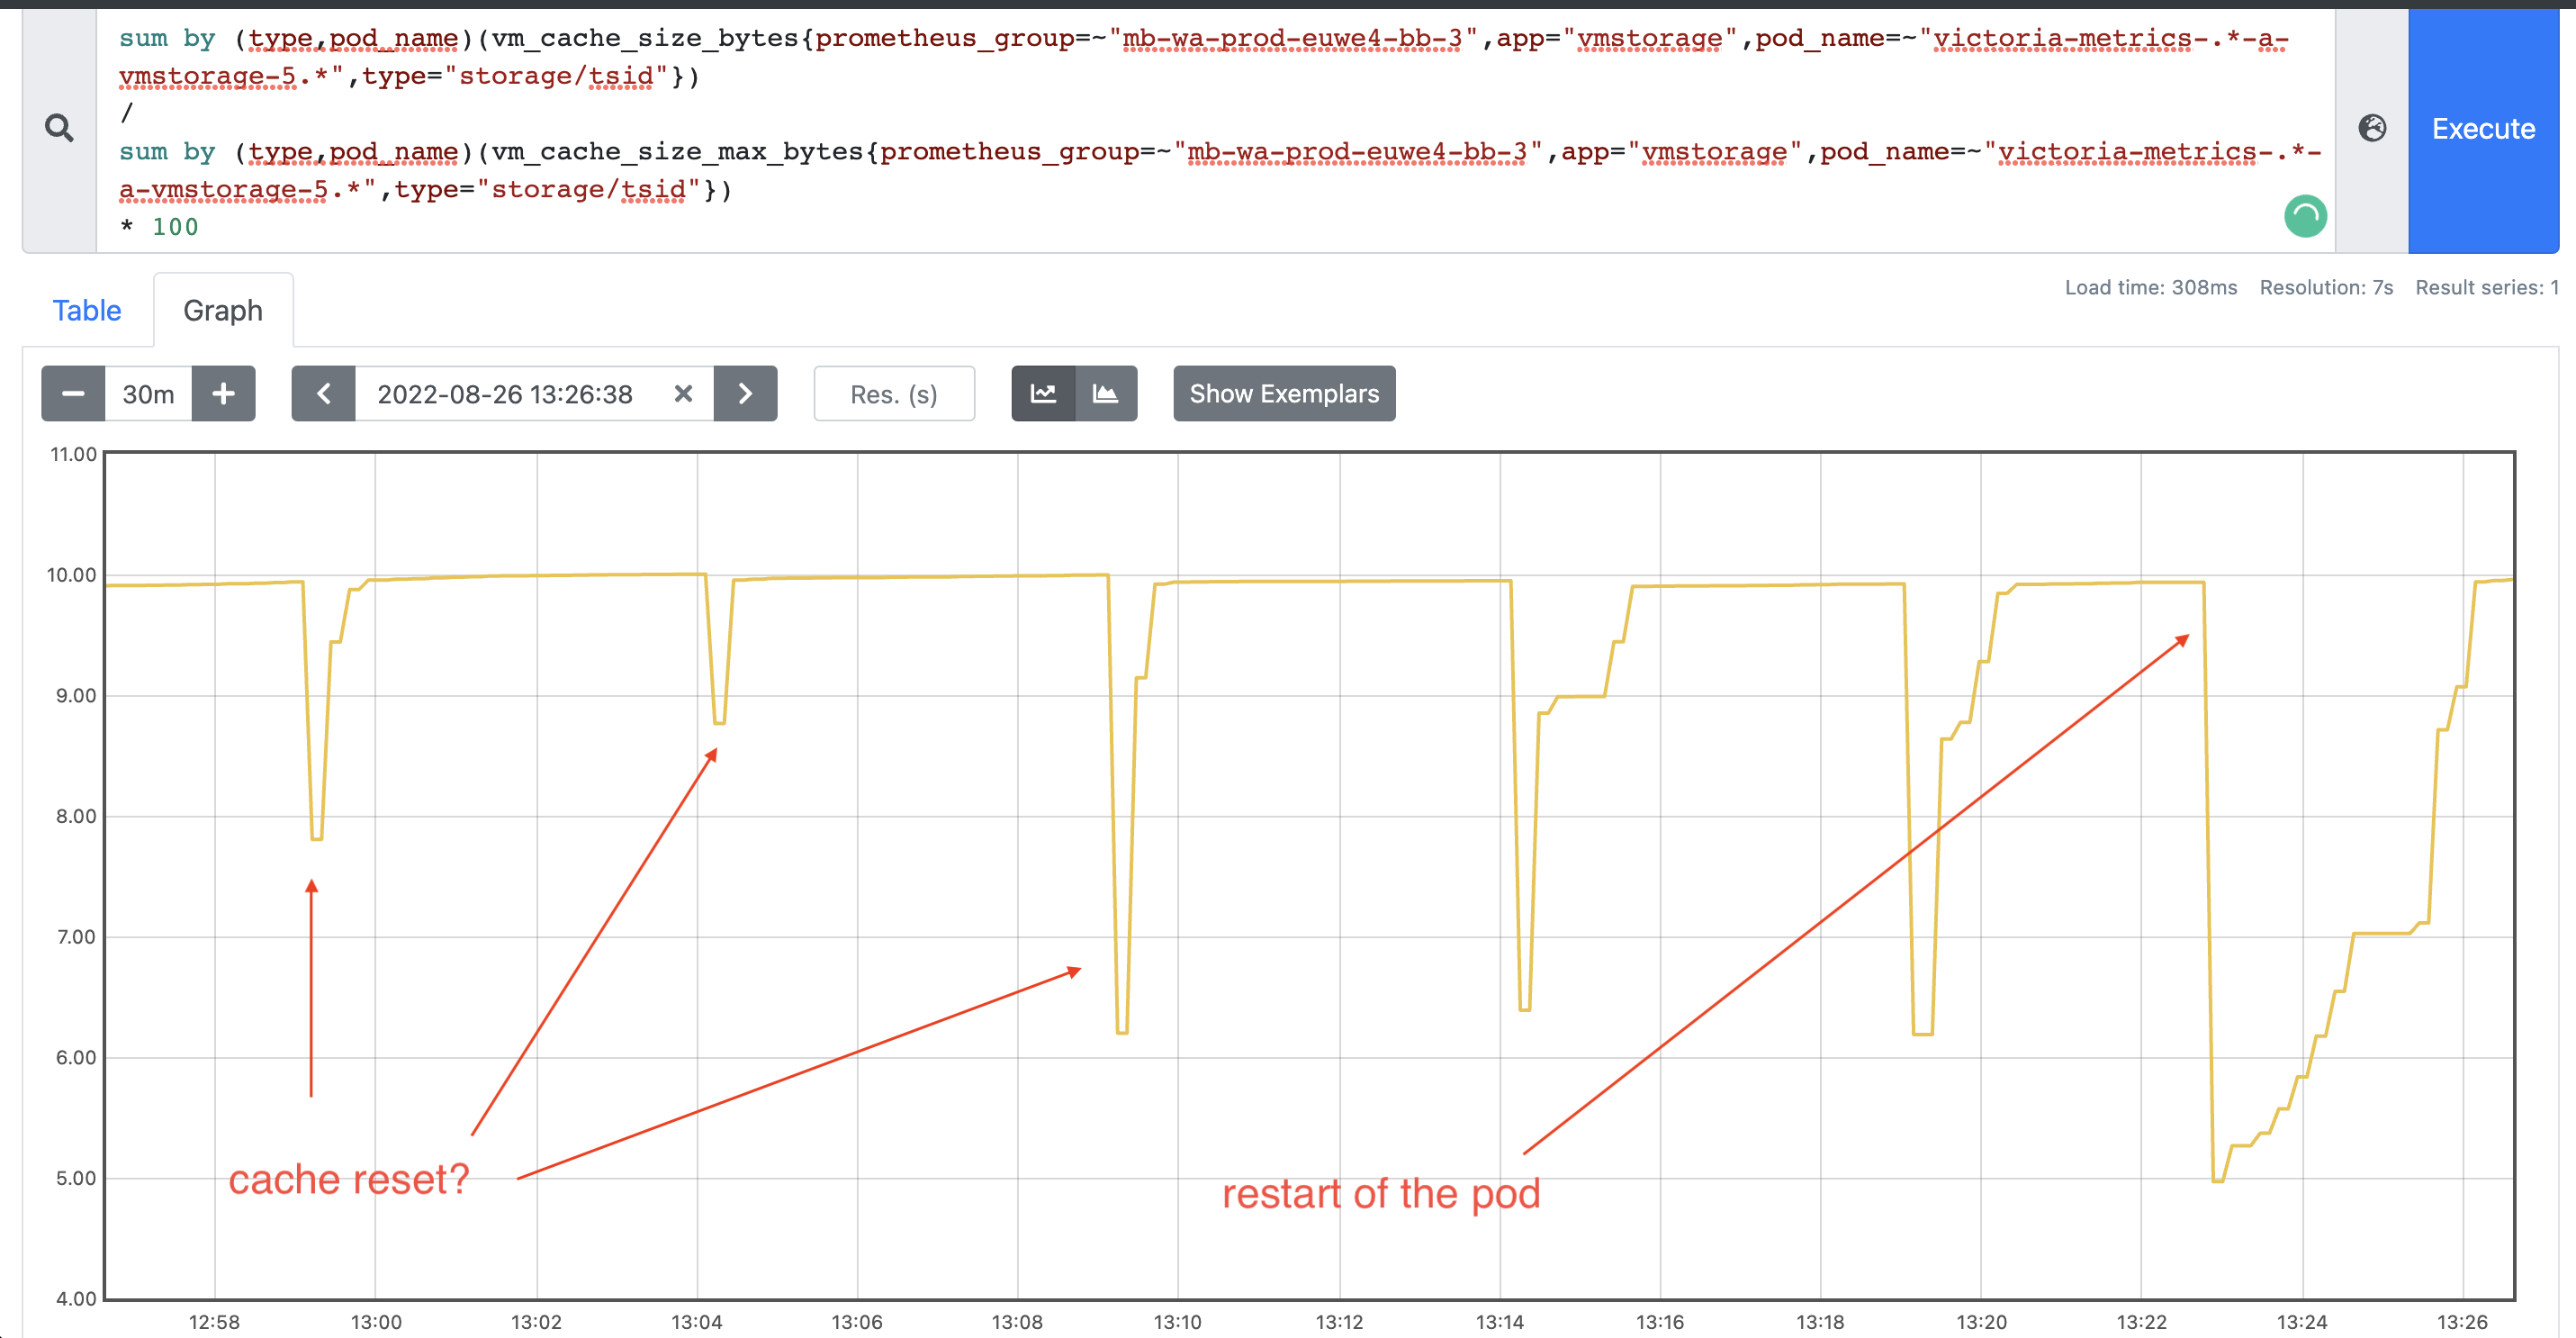
3. TSID cache lookup
Another thing that I would like to understand, is how TSID lookup works in case of a cache miss? which files
vmstorageis trying to read? I thought that force merge on heavy nodes for old partitions (> 2 months) will help us and speed up TSID lookup, but seems like we got even slower injection rate after that (more IO reads)4. Adding new shards
If we are adding more shards to the growing cluster, is there a way to rebalance data between shards? because obviously, new shards would be light and fast, but old ones still be slow. So from here I only see two options to make them equal:
retention periodfor old data to be dropped from the old shardsvmctlis there another way?
“We recommend to run a cluster with big number of small vmstorage nodes instead of a cluster with small number of big vmstorage nodes. This increases chances that the cluster remains available and stable when some of vmstorage nodes are temporarily unavailable during maintenance events such as upgrades, configuration changes or migrations.”
See more details here https://docs.victoriametrics.com/Cluster-VictoriaMetrics.html#capacity-planning
Ok! Thank you for good conversation!