traefik: Possible memory leak, regexp instructions consuming a lot of memory
Do you want to request a feature or report a bug?
Bug
What did you do?
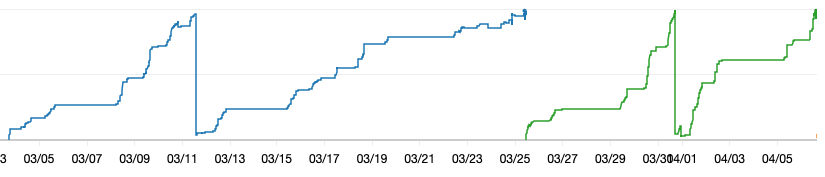
We run a single Traefik node in a Docker container (started via Nomad) on an AWS t3.medium EC2 instance hooked up to a Consul network, and our workflow involves creating many thousands of Nomad jobs that are made accessible to the wider internet via Traefik. Traefik works fine for this, but exhibits leaky behavior as it stays up longer, until it eventually kills the EC2 instance or gets restarted by Nomad.
We initially noticed this on Traefik v2.2.5, and upgraded to v.2.3.7 to see if that fixed the issue, but sadly it did not.
What did you expect to see?
Memory falling after Nomad jobs are completed and the applications are no longer accessible.
What did you see instead?
Memory growing unbounded.
Output of traefik version: (What version of Traefik are you using?)
/ # traefik version
Version:      2.3.7
Codename:     picodon
Go version:   go1.15.6
Built:        2021-01-11T18:03:02Z
OS/Arch:      linux/amd64
What is your environment & configuration (arguments, toml, provider, platform, …)?
Environment variables:
# env | grep TRAEFIK
TRAEFIK_METRICS_STATSD_ADDRESS=127.0.0.1:8125
TRAEFIK_PROVIDERS_CONSULCATALOG_EXPOSEDBYDEFAULT=false
TRAEFIK_LOG_LEVEL=INFO
TRAEFIK_ACCESSLOG=true
TRAEFIK_LOG_FORMAT=json
TRAEFIK_ACCESSLOG_FORMAT=json
TRAEFIK_ENTRYPOINTS_tcp_ADDRESS=:5672
TRAEFIK_METRICS_STATSD=true
TRAEFIK_PROVIDERS_CONSULCATALOG_ENDPOINT_SCHEME=http
TRAEFIK_ENTRYPOINTS_http_ADDRESS=:8080
TRAEFIK_PROVIDERS_CONSULCATALOG_ENDPOINT_ADDRESS=127.0.0.1:8500
TRAEFIK_API_DEBUG=true
TRAEFIK_API_INSECURE=true
TRAEFIK_API_DASHBOARD=true
TRAEFIK_ENTRYPOINTS_traefik_ADDRESS=:8081
TRAEFIK_PROVIDERS_CONSULCATALOG_PREFIX=traefik
TRAEFIK_LOG=true
We configure the Nomad jobs we access through Traefik with some middlewares as well. We define these for every job when we submit them to Nomad.
"traefik.enable=true",
"traefik.http.routers.<app-id>.rule=PathPrefix(`/<app-id>/`",
"traefik.http.routers.<app-id>.middlewares=cloud-auth,<app-id>
    + (hasBasicAuth ? ",auth-" + <app-id> : ""),
"traefik.http.middlewares.<app-id>.stripprefix.prefixes=/"<app-id>/",
"traefik.http.middlewares.<app-id>.stripprefix.forceslash=false")
If applicable, please paste the log output in DEBUG level (--log.level=DEBUG switch)
I gathered this pprof data that shows the problem:
sh-4.2$ go tool pprof http://localhost:8081/debug/pprof/heap
Fetching profile over HTTP from http://localhost:8081/debug/pprof/heap
Saved profile in /home/ssm-user/pprof/pprof.traefik.alloc_objects.alloc_space.inuse_objects.inuse_space.003.pb.gz
File: traefik
Type: inuse_space
Time: Apr 9, 2021 at 2:44pm (UTC)
Entering interactive mode (type "help" for commands, "o" for options)
(pprof) top
Showing nodes accounting for 190.30MB, 66.66% of 285.50MB total
Dropped 60 nodes (cum <= 1.43MB)
Showing top 10 nodes out of 146
      flat  flat%   sum%        cum   cum%
  102.76MB 35.99% 35.99%   102.76MB 35.99%  regexp/syntax.(*compiler).inst (inline)
   14.50MB  5.08% 41.07%    14.50MB  5.08%  github.com/traefik/traefik/v2/pkg/middlewares/auth.getUsers
      14MB  4.90% 45.98%       14MB  4.90%  github.com/traefik/traefik/v2/pkg/config/runtime.(*ServiceInfo).UpdateServerStatus
      12MB  4.20% 50.18%       12MB  4.20%  github.com/gorilla/mux.(*Router).NewRoute
   10.50MB  3.68% 53.86%    10.50MB  3.68%  regexp/syntax.(*parser).maybeConcat
       9MB  3.15% 57.01%        9MB  3.15%  github.com/traefik/traefik/v2/pkg/server/provider.MakeQualifiedName
       8MB  2.80% 59.82%   122.77MB 43.00%  regexp.compile
    6.53MB  2.29% 62.10%     6.53MB  2.29%  bufio.NewReaderSize
    6.50MB  2.28% 64.38%     6.50MB  2.28%  github.com/vulcand/oxy/utils.CopyURL
    6.50MB  2.28% 66.66%     6.50MB  2.28%  encoding/json.(*decodeState).literalStore
About this issue
- Original URL
- State: closed
- Created 3 years ago
- Reactions: 1
- Comments: 30 (6 by maintainers)
Our team has recently attempted to upgrade from Traefik v1.7.20 to 2.4.8, and we immediately ran into memory issues. Even after tripling the memory limit on our Traefik Kubernetes deployment (8Gi to 24Gi), we’re having Traefik pods OOMkilled in production very frequently - so much so that we’re in the process of rolling back to v1 😞
Our symptoms have been similar to this issue, as well as #7964. One thing to note is that we are not actively using any Middleware for our ingress resources, in case that helps to narrow things down. We are using
HostRegexpin a handful of our ingresses, andpprofseems to also point towards the regexp libraries being an issue.Here’s the same output sorted by cumulative memory usage
@kungfukennyg
We were able to reproduce a memory leak, but the circumstances are closer to what is described in #7964 , so we don’t know if this will apply to you, but: we pushed a work-around to the v2.5 experimental image (experimental-v2.5), so you could always try to see if it helps with your problem.
Please let us know if that leads to any additional information.
Any updates on this issue? Didn’t want to create duplicate but I have exactly the same issue, also mentioned in the ticket #7964, tested on 2.3.* and now running 2.4.8, issue is still there, and leak goes up with the network traffic, in my case k8s kills deployment ones a week, and we are running production project with the proxy, so would be great to know if this will be fixed any time soon, or if there any workaround?
Happy to help with debugging and provided additional information if needed.
Also for a record I’m running 2 separate projects on 2 separate clusters, both have ~same traffic, one runes on 2.3.2 and another one upgraded from 2.3.2 to 2.4.8 (but didn’t fix the issue).
Main difference between 2 projects, second one with the issue heavily relies on regex due to the project requirements, and has one TCP endpoint vs first one mostly static endpoints and all http.
We’ve done some testing with version
2.5.7(which I assume, based on the release logs, contains the memory leak fix you mentioned on branchexperimental-v2.5) and sadly are still seeing the same leaky behavior.For comparison, I’m attaching a second heap profile from an instance after it has been restarted and before it serves any requests (aside from health checks). I.e. prior to it exhibiting any leak.
The Ingress configurations and Endpoints in our Kubernetes clusters are very similar to when I captured the heap profile in my previous comment. But as one can see, the heap is about 4 times larger and seems to be retaining about 4 times the amount of Routers. Because the Ingress configuration in the API is roughly the same, I wouldn’t expect the corresponding Routers to occupy 4x the amount of heap space. It seems to me like we’ve leaked 3-4 references to old Router versions (provider will trigger a rebuild of a new Router version as often as every 2 seconds, if there are updates in the Kubernetes APIs). Short of capturing a core dump, I’m not sure the best way to narrow down where the references might be escaping.
I’m still trying to figure out a sensible way to trigger and preserve a core dump for a traefik replica running in Kubernetes, but if it is fruitful I’ll try updating this issue with more information.
2021-08-04-20:05:56-heap.pprof.zip
At this point, I’m a bit stumped about what the problem might be. I added some additional logging around recovered panics, including some additional metadata about duration. I do see all of my panicked request handlers taking less 301 seconds.
I’m attaching a heap profile from one of our instances after we stopped sending it requests to proxy. It didn’t start leaking memory until we sent it requests, but even after we turned off requests, the memory remains elevated. Prior to sending it requests, the memory remained low for several days.
This is a blocker for us for adopting traefik v2, and considering looming incompatibilities between traefik v1 and newer Kubernetes versions due to the removal of beta Ingress API versions, this might force us to abandon traefik in lieu of a different Ingress controller implementation. 😞
2021-08-03-20:52:22-heap.pprof.zip
It looks like v2.4.8 has alleviated the constant memory climb, thanks!
My mistake, I thought we were on the latest version! I will do so and report back.