traefik: Possible memory leak in Traefik 2 as k8s ingress controller
Hello everyone!
Do you want to request a feature or report a bug?
Bug
What did you do?
Running Traefik as an ingress controller with kubernetesCRD on an autoscaler-enabled cluster
What did you expect to see?
Traefik not consuming more and more memory over time (never going down)
What did you see instead?
Traefik consuming more and more of container_memory_rss (in big chunks) AND container_memory_working_set_bytes (small chunks)
container_memory_rss is a couple times higher than working set, and therefore is the one that results in an OOM kill.
Output of traefik version: (What version of Traefik are you using?)
2.2.11 (issue spotted) 2.4.6 (issue possibly still there? I did not roll it out yet) Deployed using a rendered helm template, but NOT controlled or maintained by Helm
What is your environment & configuration (arguments, toml, provider, platform, …)?
2.2.11 - KubernetesCRD provider enabled, Consul Catalog provider enabled but all services flagged as not enabled, File Provider enabled but it’s a small file that never changes 2.4.6 - same config, but Consul Catalog disabled for the purpose of investigation
2.2.11
configuration
    [global]
      checkNewVersion = false
      sendAnonymousUsage = false

    [serversTransport]
      insecureSkipVerify = true
      [serversTransport.forwardingTimeouts]
        dialTimeout = 10
        responseHeaderTimeout = 300
        idleConnTimeout = 30

    [entryPoints]
      [entryPoints.traefik]
        address = ":9000"
        [entryPoints.traefik.transport]
          [entryPoints.traefik.transport.lifeCycle]
            requestAcceptGraceTimeout = 5
            graceTimeOut = 15
          [entryPoints.traefik.transport.respondingTimeouts]
            readTimeout = 300
            writeTimeout = 300
            idleTimeout = 120
      [entryPoints.web]
        address = ":80"
        [entryPoints.web.forwardedHeaders]
          trustedIPs = ["redacted", "redacted", "redacted"]
        [entryPoints.web.transport]
          [entryPoints.web.transport.lifeCycle]
            requestAcceptGraceTimeout = 5
            graceTimeOut = 15
          [entryPoints.web.transport.respondingTimeouts]
            readTimeout = 300
            writeTimeout = 300
            idleTimeout = 120
      [entryPoints.websecure]
        address = ":443"
        [entryPoints.websecure.forwardedHeaders]
          trustedIPs = ["redacted", "redacted", "redacted"]
        [entryPoints.websecure.transport]
          [entryPoints.websecure.transport.lifeCycle]
            requestAcceptGraceTimeout = 5
            graceTimeOut = 15
          [entryPoints.websecure.transport.respondingTimeouts]
            readTimeout = 300
            writeTimeout = 300
            idleTimeout = 120

    [providers]
      providersThrottleDuration = 10
      [providers.file]
        watch = true
        filename = "/etc/traefik/traefik_file_provider.toml"
        debugLogGeneratedTemplate = true
      [providers.kubernetesCRD]
      [providers.consulCatalog]
        prefix = "traefik-k8s-brand"
        exposedByDefault = false

    [api]
      insecure = true
      dashboard = true

    [metrics]
      [metrics.prometheus]
        buckets = [0.100000, 0.300000, 1.000000, 5.000000]
        addEntryPointsLabels = true
        addServicesLabels = true

    [ping]
      entryPoint = "traefik"

    [log]
      level = "WARN"

    [accessLog]
Traefik setup: A single domain/host used (therefore skipped in configs, so only path matters). 1 TLS cert in kube-system, used by all ingress routes. Cert is present in a secret, no auto-generation is used. About 1400 routers, and 700 middlewares (only stripprefix, nothing more) All of them are identical, except for the path to match on. Half of them are for http, half for https (middleware is shared, hence its number), to support both protocols no matter which one is needed. Cluster size is ~ 60 nodes (mostly spot instances), and ~ 2000 pods. k8s 1.18.9
Example
spec:
  entryPoints:
  - websecure
  routes:
  - kind: Rule
    match: PathPrefix(`/some_namespace/some_service_name/`)
    middlewares:
    - name: some_service_name-strip-prefix
      namespace: some_namespace
    services:
    - kind: Service
      name: some_service_name
      port: 443
      scheme: https
  tls:
    options:
      name: tls-options
      namespace: kube-system
    store:
      name: default
spec:
  entryPoints:
  - web
  routes:
  - kind: Rule
    match: PathPrefix(`/some_namespace/some_service_name/`)
    middlewares:
    - name: some_service_name-strip-prefix
      namespace: some_namespace
    services:
    - kind: Service
      name: some_service_name
      port: 443
      scheme: https
The web entrypoint is practically not used though.
If applicable, please paste the log output in DEBUG level (--log.level=DEBUG switch)
Debug is from 2.4.6 only. Mostly a spam of
time="2021-03-08T10:29:36Z" level=debug msg="No secret name provided" providerName=kubernetescrd
From what I know this is harmless, I didn’t want to put the cert in every namespace since it’s shared anyway, and I didn’t see an option to specify the secret name from a different namespace (like you can for middleware)
And
No domain found in rule PathPrefix(`/some_namespace/some_service_name/`), the TLS options applied for this router will depend on the hostSNI of each request" entryPointName=websecure routerName=some_namespace-some_service_name-https-ea146c6e0f9a0b71c911@kubernetescrd
2.2.11 memory usage (where I spotted the issue originally)
Screenshots
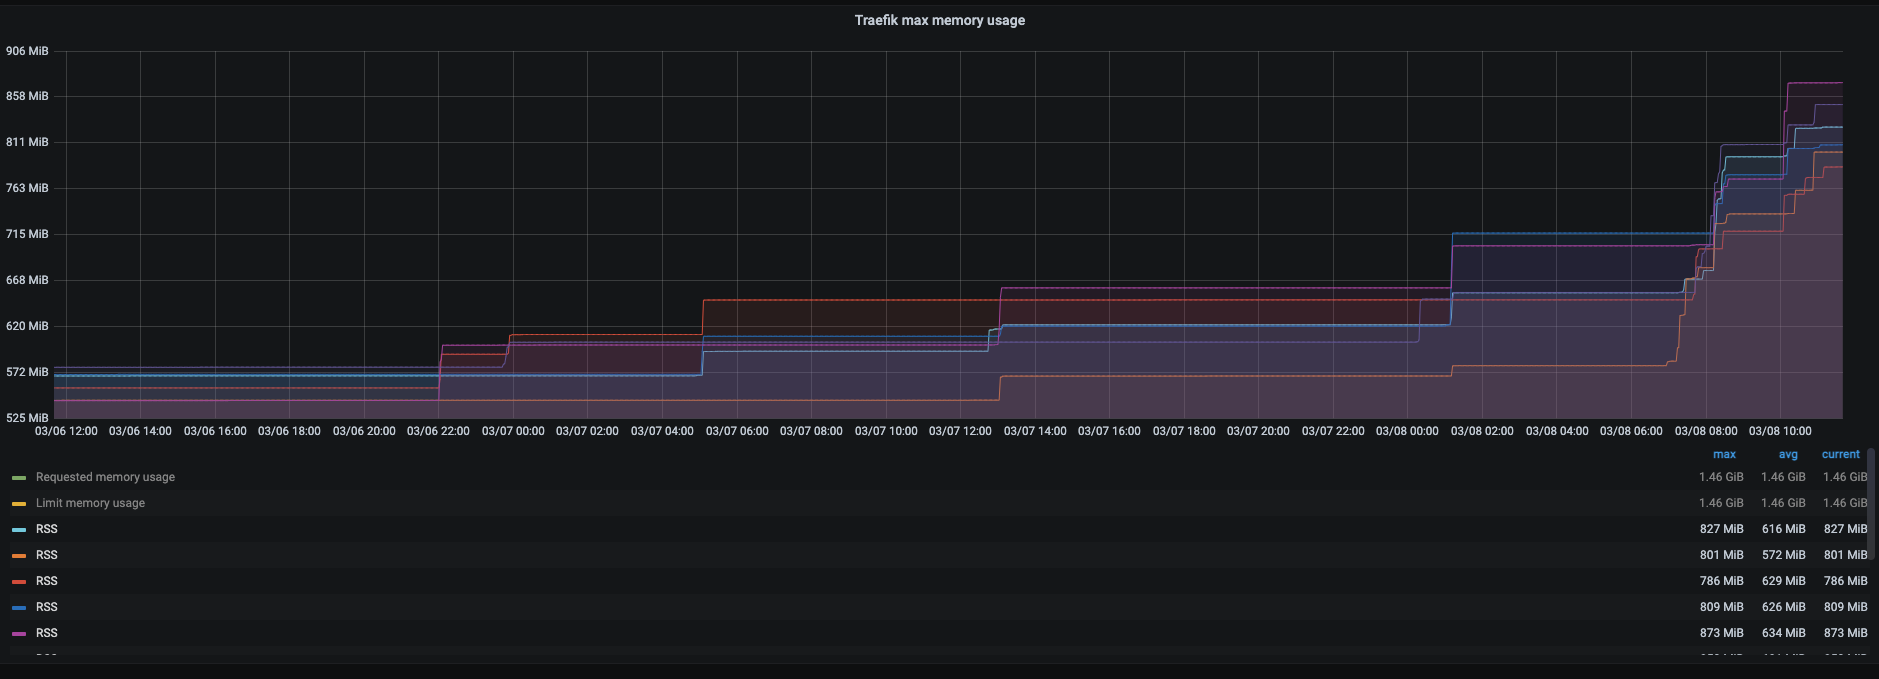
Some observations:
- memory almost always grows at a similar time for multiple traefik replicas (they never run on the same machine)
- RPS does not seem to matter?
- if you restart a replica, it will rather quickly catch up to the usage of the rest (this one’s weird). Quickly as in it takes less time than for the other replicas to have accumulated it from the start.
Here’s a heap pprof from 2.4.6 for now (I can’t do the “proper” 2.2.11)
heap pprof
File: traefik
Type: inuse_space
Time: Mar 8, 2021 at 12:08pm (CET)
Showing nodes accounting for 130.84MB, 91.24% of 143.41MB total
Dropped 103 nodes (cum <= 0.72MB)
      flat  flat%   sum%        cum   cum%
   22.04MB 15.37% 15.37%    22.04MB 15.37%  regexp/syntax.(*compiler).inst (inline)
   10.20MB  7.11% 22.48%    10.20MB  7.11%  github.com/traefik/traefik/v2/pkg/config/runtime.NewConfig
      10MB  6.97% 29.45%       10MB  6.97%  github.com/traefik/traefik/v2/pkg/config/runtime.(*ServiceInfo).UpdateServerStatus
    9.50MB  6.63% 36.08%    16.50MB 11.51%  github.com/traefik/traefik/v2/pkg/config/dynamic.(*HTTPConfiguration).DeepCopyInto
    8.50MB  5.93% 42.01%     8.50MB  5.93%  github.com/vulcand/oxy/utils.CopyURL (inline)
       6MB  4.18% 46.19%        6MB  4.18%  github.com/traefik/traefik/v2/pkg/server/provider.MakeQualifiedName (inline)
    4.50MB  3.14% 49.33%     4.50MB  3.14%  github.com/gorilla/mux.(*Router).NewRoute (inline)
    4.07MB  2.84% 52.17%     4.07MB  2.84%  reflect.unsafe_NewArray
       3MB  2.09% 54.26%     4.50MB  3.14%  github.com/gorilla/mux.(*Route).Subrouter (inline)
       3MB  2.09% 56.35%        3MB  2.09%  github.com/traefik/traefik/v2/pkg/config/dynamic.(*Router).DeepCopyInto
       3MB  2.09% 58.44%        4MB  2.79%  github.com/mitchellh/hashstructure.hashUpdateOrdered
    2.50MB  1.74% 60.19%     2.50MB  1.74%  github.com/json-iterator/go.(*Iterator).readStringSlowPath
    2.50MB  1.74% 61.93%     2.50MB  1.74%  github.com/traefik/traefik/v2/pkg/middlewares/metrics.NewServiceMiddleware
    2.50MB  1.74% 63.67%     3.50MB  2.44%  github.com/traefik/traefik/v2/pkg/config/dynamic.(*Service).DeepCopyInto
    2.50MB  1.74% 65.42%     7.50MB  5.23%  github.com/mitchellh/hashstructure.(*walker).visit
       2MB  1.40% 66.81%        2MB  1.40%  reflect.mapassign
       2MB  1.39% 68.21%        2MB  1.39%  regexp/syntax.(*parser).maybeConcat
       2MB  1.39% 69.60%    26.54MB 18.51%  regexp.compile
       2MB  1.39% 71.00%        2MB  1.39%  github.com/traefik/traefik/v2/pkg/middlewares/tracing.NewWrapper (inline)
       2MB  1.39% 72.39%     4.50MB  3.14%  github.com/json-iterator/go.(*Iterator).ReadString
       2MB  1.39% 73.78%        2MB  1.39%  github.com/gorilla/mux.(*Route).addMatcher (inline)
    1.51MB  1.05% 74.83%     1.51MB  1.05%  bufio.NewWriterSize (inline)
    1.50MB  1.05% 75.88%     1.50MB  1.05%  github.com/traefik/traefik/v2/pkg/metrics.buildMetricID
    1.50MB  1.05% 76.93%     1.50MB  1.05%  github.com/vulcand/oxy/roundrobin.New
    1.50MB  1.05% 77.97%    28.54MB 19.90%  github.com/gorilla/mux.newRouteRegexp
    1.50MB  1.05% 79.02%     1.50MB  1.05%  github.com/traefik/traefik/v2/pkg/middlewares/tracing.NewForwarder
    1.50MB  1.05% 80.06%     1.50MB  1.05%  github.com/traefik/traefik/v2/pkg/healthcheck.NewLBStatusUpdater (inline)
    1.50MB  1.05% 81.11%     1.50MB  1.05%  strings.(*Builder).WriteString (inline)
    1.50MB  1.05% 82.16%     1.50MB  1.05%  go/scanner.(*Scanner).scanRawString
    1.50MB  1.05% 83.20%     1.50MB  1.05%  encoding/binary.Write
    1.02MB  0.71% 83.91%     1.02MB  0.71%  k8s.io/utils/buffer.NewRingGrowing (inline)
    1.01MB   0.7% 84.61%     1.01MB   0.7%  crypto/aes.sliceForAppend (inline)
       1MB   0.7% 85.31%        1MB   0.7%  runtime.malg
       1MB   0.7% 86.01%        1MB   0.7%  github.com/traefik/traefik/v2/pkg/config/dynamic.(*ServersLoadBalancer).DeepCopyInto
       1MB   0.7% 86.71%        1MB   0.7%  github.com/traefik/traefik/v2/pkg/middlewares/accesslog.NewFieldHandler (inline)
       1MB   0.7% 87.40%        1MB   0.7%  strings.(*Builder).grow (inline)
       1MB   0.7% 88.10%        1MB   0.7%  github.com/gorilla/mux.(*Route).getRegexpGroup
       1MB   0.7% 88.80%        1MB   0.7%  github.com/traefik/traefik/v2/pkg/server/service.buildProxy
       1MB   0.7% 89.49%        1MB   0.7%  fmt.Sprintf
       1MB   0.7% 90.19%     9.50MB  6.63%  github.com/vulcand/oxy/roundrobin.(*RoundRobin).UpsertServer
    0.50MB  0.35% 90.54%     1.50MB  1.05%  github.com/traefik/traefik/v2/pkg/provider/kubernetes/crd.configBuilder.loadServers
    0.50MB  0.35% 90.89%     1.50MB  1.05%  github.com/traefik/traefik/v2/pkg/api.Handler.createRouter
    0.50MB  0.35% 91.24%    35.50MB 24.76%  github.com/traefik/traefik/v2/pkg/server/router.(*Manager).buildHTTPHandler
         0     0% 91.24%     1.01MB   0.7%  crypto/aes.(*gcmAsm).Seal
         0     0% 91.24%        1MB   0.7%  crypto/tls.(*Conn).Handshake
         0     0% 91.24%     1.01MB   0.7%  crypto/tls.(*Conn).Write
         0     0% 91.24%        1MB   0.7%  crypto/tls.(*Conn).clientHandshake
         0     0% 91.24%     1.01MB   0.7%  crypto/tls.(*Conn).writeRecordLocked
         0     0% 91.24%        1MB   0.7%  crypto/tls.(*clientHandshakeStateTLS13).handshake
         0     0% 91.24%     1.01MB   0.7%  crypto/tls.(*halfConn).encrypt
         0     0% 91.24%     1.01MB   0.7%  crypto/tls.(*prefixNonceAEAD).Seal
         0     0% 91.24%    12.02MB  8.38%  github.com/cenkalti/backoff/v4.RetryNotify (inline)
         0     0% 91.24%    12.02MB  8.38%  github.com/cenkalti/backoff/v4.RetryNotifyWithTimer
         0     0% 91.24%     7.50MB  5.23%  github.com/containous/alice.Chain.Then
         0     0% 91.24%     1.50MB  1.05%  github.com/go-kit/kit/metrics/multi.Counter.Add
         0     0% 91.24%    29.54MB 20.60%  github.com/gorilla/mux.(*Route).PathPrefix (inline)
         0     0% 91.24%    30.04MB 20.95%  github.com/gorilla/mux.(*Route).addRegexpMatcher
         0     0% 91.24%    31.54MB 22.00%  github.com/gorilla/mux.(*Router).PathPrefix
         0     0% 91.24%     4.54MB  3.16%  github.com/gorilla/mux.(*Router).ServeHTTP
         0     0% 91.24%        1MB   0.7%  github.com/gorilla/mux.(*Router).getRegexpGroup
         0     0% 91.24%    11.07MB  7.72%  github.com/json-iterator/go.(*Iterator).ReadVal
         0     0% 91.24%        1MB   0.7%  github.com/json-iterator/go.(*OptionalDecoder).Decode
         0     0% 91.24%     2.50MB  1.74%  github.com/json-iterator/go.(*fiveFieldsStructDecoder).Decode
         0     0% 91.24%    11.07MB  7.72%  github.com/json-iterator/go.(*fourFieldsStructDecoder).Decode
         0     0% 91.24%    11.07MB  7.72%  github.com/json-iterator/go.(*frozenConfig).Unmarshal
         0     0% 91.24%        6MB  4.19%  github.com/json-iterator/go.(*generalStructDecoder).Decode
         0     0% 91.24%        6MB  4.19%  github.com/json-iterator/go.(*generalStructDecoder).decodeOneField
         0     0% 91.24%        6MB  4.19%  github.com/json-iterator/go.(*mapDecoder).Decode
         0     0% 91.24%     5.50MB  3.84%  github.com/json-iterator/go.(*placeholderDecoder).Decode
         0     0% 91.24%    10.57MB  7.37%  github.com/json-iterator/go.(*sliceDecoder).Decode
         0     0% 91.24%    10.57MB  7.37%  github.com/json-iterator/go.(*sliceDecoder).doDecode
         0     0% 91.24%     4.50MB  3.14%  github.com/json-iterator/go.(*stringCodec).Decode
         0     0% 91.24%    11.07MB  7.72%  github.com/json-iterator/go.(*structFieldDecoder).Decode
         0     0% 91.24%     1.50MB  1.05%  github.com/json-iterator/go.(*threeFieldsStructDecoder).Decode
         0     0% 91.24%     7.50MB  5.23%  github.com/mitchellh/hashstructure.Hash
         0     0% 91.24%        2MB  1.40%  github.com/modern-go/reflect2.(*UnsafeMapType).UnsafeSetIndex (inline)
         0     0% 91.24%     4.07MB  2.84%  github.com/modern-go/reflect2.(*UnsafeSliceType).UnsafeGrow
         0     0% 91.24%     4.07MB  2.84%  github.com/modern-go/reflect2.(*UnsafeSliceType).UnsafeMakeSlice (inline)
         0     0% 91.24%     1.50MB  1.05%  github.com/traefik/traefik/v2/pkg/api.NewBuilder.func1
         0     0% 91.24%    16.50MB 11.51%  github.com/traefik/traefik/v2/pkg/config/dynamic.(*Configuration).DeepCopyInto
         0     0% 91.24%    16.50MB 11.51%  github.com/traefik/traefik/v2/pkg/config/dynamic.(*Message).DeepCopy (inline)
         0     0% 91.24%    16.50MB 11.51%  github.com/traefik/traefik/v2/pkg/config/dynamic.(*Message).DeepCopyInto
         0     0% 91.24%       21MB 14.65%  github.com/traefik/traefik/v2/pkg/healthcheck.(*LbStatusUpdater).UpsertServer
         0     0% 91.24%        1MB   0.7%  github.com/traefik/traefik/v2/pkg/metrics.(*HistogramWithScale).ObserveFromStart
         0     0% 91.24%     1.50MB  1.05%  github.com/traefik/traefik/v2/pkg/metrics.(*counter).Add
         0     0% 91.24%        1MB   0.7%  github.com/traefik/traefik/v2/pkg/metrics.(*histogram).Observe
         0     0% 91.24%        1MB   0.7%  github.com/traefik/traefik/v2/pkg/metrics.MultiHistogram.ObserveFromStart
         0     0% 91.24%     1.50MB  1.05%  github.com/traefik/traefik/v2/pkg/metrics.newCollector (inline)
         0     0% 91.24%     3.50MB  2.44%  github.com/traefik/traefik/v2/pkg/middlewares.(*HTTPHandlerSwitcher).ServeHTTP
         0     0% 91.24%     4.54MB  3.16%  github.com/traefik/traefik/v2/pkg/middlewares/accesslog.(*FieldHandler).ServeHTTP
         0     0% 91.24%     3.50MB  2.44%  github.com/traefik/traefik/v2/pkg/middlewares/accesslog.(*Handler).ServeHTTP
         0     0% 91.24%     4.03MB  2.81%  github.com/traefik/traefik/v2/pkg/middlewares/accesslog.AddOriginFields
         0     0% 91.24%     1.03MB  0.72%  github.com/traefik/traefik/v2/pkg/middlewares/accesslog.AddServiceFields
         0     0% 91.24%     3.50MB  2.44%  github.com/traefik/traefik/v2/pkg/middlewares/accesslog.WrapHandler.func1.1
         0     0% 91.24%     4.54MB  3.16%  github.com/traefik/traefik/v2/pkg/middlewares/emptybackendhandler.(*emptyBackend).ServeHTTP
         0     0% 91.24%     3.50MB  2.44%  github.com/traefik/traefik/v2/pkg/middlewares/forwardedheaders.(*XForwarded).ServeHTTP
         0     0% 91.24%     4.54MB  3.16%  github.com/traefik/traefik/v2/pkg/middlewares/metrics.(*metricsMiddleware).ServeHTTP
         0     0% 91.24%     2.50MB  1.74%  github.com/traefik/traefik/v2/pkg/middlewares/metrics.WrapServiceHandler.func1
         0     0% 91.24%     1.03MB  0.72%  github.com/traefik/traefik/v2/pkg/middlewares/pipelining.(*pipelining).ServeHTTP
         0     0% 91.24%     4.54MB  3.16%  github.com/traefik/traefik/v2/pkg/middlewares/recovery.(*recovery).ServeHTTP
         0     0% 91.24%     4.03MB  2.81%  github.com/traefik/traefik/v2/pkg/middlewares/requestdecorator.(*RequestDecorator).ServeHTTP
         0     0% 91.24%     3.50MB  2.44%  github.com/traefik/traefik/v2/pkg/middlewares/requestdecorator.WrapHandler.func1.1
         0     0% 91.24%     4.54MB  3.16%  github.com/traefik/traefik/v2/pkg/middlewares/stripprefix.(*stripPrefix).ServeHTTP
         0     0% 91.24%     4.54MB  3.16%  github.com/traefik/traefik/v2/pkg/middlewares/stripprefix.(*stripPrefix).serveRequest
         0     0% 91.24%     4.54MB  3.16%  github.com/traefik/traefik/v2/pkg/middlewares/tracing.(*Wrapper).ServeHTTP
         0     0% 91.24%     4.54MB  3.16%  github.com/traefik/traefik/v2/pkg/middlewares/tracing.(*forwarderMiddleware).ServeHTTP
         0     0% 91.24%     2.50MB  1.74%  github.com/traefik/traefik/v2/pkg/middlewares/tracing.Wrap.func1
         0     0% 91.24%        1MB   0.7%  github.com/traefik/traefik/v2/pkg/provider.Normalize
         0     0% 91.24%    12.02MB  8.38%  github.com/traefik/traefik/v2/pkg/provider/kubernetes/crd.(*Provider).Provide.func1
         0     0% 91.24%    12.02MB  8.38%  github.com/traefik/traefik/v2/pkg/provider/kubernetes/crd.(*Provider).Provide.func1.1
         0     0% 91.24%     3.50MB  2.44%  github.com/traefik/traefik/v2/pkg/provider/kubernetes/crd.(*Provider).loadConfigurationFromCRD
         0     0% 91.24%     3.50MB  2.44%  github.com/traefik/traefik/v2/pkg/provider/kubernetes/crd.(*Provider).loadIngressRouteConfiguration
         0     0% 91.24%     1.02MB  0.71%  github.com/traefik/traefik/v2/pkg/provider/kubernetes/crd.(*clientWrapper).WatchAll
         0     0% 91.24%     1.50MB  1.05%  github.com/traefik/traefik/v2/pkg/provider/kubernetes/crd.configBuilder.buildServersLB
         0     0% 91.24%     1.50MB  1.05%  github.com/traefik/traefik/v2/pkg/provider/kubernetes/crd.configBuilder.nameAndService
         0     0% 91.24%     4.30MB  3.00%  github.com/traefik/traefik/v2/pkg/provider/kubernetes/crd/generated/clientset/versioned/typed/traefik/v1alpha1.(*ingressRoutes).List
         0     0% 91.24%     0.76MB  0.53%  github.com/traefik/traefik/v2/pkg/provider/kubernetes/crd/generated/clientset/versioned/typed/traefik/v1alpha1.(*middlewares).List
         0     0% 91.24%     4.30MB  3.00%  github.com/traefik/traefik/v2/pkg/provider/kubernetes/crd/generated/informers/externalversions/traefik/v1alpha1.NewFilteredIngressRouteInformer.func1
         0     0% 91.24%     0.76MB  0.53%  github.com/traefik/traefik/v2/pkg/provider/kubernetes/crd/generated/informers/externalversions/traefik/v1alpha1.NewFilteredMiddlewareInformer.func1
         0     0% 91.24%    40.04MB 27.92%  github.com/traefik/traefik/v2/pkg/rules.(*Router).AddRoute
         0     0% 91.24%    36.54MB 25.48%  github.com/traefik/traefik/v2/pkg/rules.addRuleOnRoute
         0     0% 91.24%    11.01MB  7.68%  github.com/traefik/traefik/v2/pkg/rules.addRuleOnRouter
         0     0% 91.24%    36.04MB 25.13%  github.com/traefik/traefik/v2/pkg/rules.pathPrefix
         0     0% 91.24%   119.76MB 83.51%  github.com/traefik/traefik/v2/pkg/safe.(*Pool).GoCtx.func1
         0     0% 91.24%   119.76MB 83.51%  github.com/traefik/traefik/v2/pkg/safe.GoWithRecover.func1
         0     0% 91.24%    12.02MB  8.38%  github.com/traefik/traefik/v2/pkg/safe.OperationWithRecover.func1
         0     0% 91.24%    91.24MB 63.63%  github.com/traefik/traefik/v2/pkg/server.(*ConfigurationWatcher).listenConfigurations
         0     0% 91.24%    91.24MB 63.63%  github.com/traefik/traefik/v2/pkg/server.(*ConfigurationWatcher).loadMessage
         0     0% 91.24%    16.50MB 11.51%  github.com/traefik/traefik/v2/pkg/server.(*ConfigurationWatcher).preLoadConfiguration.func1
         0     0% 91.24%    16.50MB 11.51%  github.com/traefik/traefik/v2/pkg/server.(*ConfigurationWatcher).throttleProviderConfigReload
         0     0% 91.24%    77.55MB 54.08%  github.com/traefik/traefik/v2/pkg/server.(*RouterFactory).CreateRouters
         0     0% 91.24%     3.50MB  2.44%  github.com/traefik/traefik/v2/pkg/server.mergeConfiguration
         0     0% 91.24%     2.50MB  1.74%  github.com/traefik/traefik/v2/pkg/server/middleware.(*Builder).BuildChain.func1
         0     0% 91.24%     2.50MB  1.74%  github.com/traefik/traefik/v2/pkg/server/provider.GetQualifiedName
         0     0% 91.24%    76.05MB 53.03%  github.com/traefik/traefik/v2/pkg/server/router.(*Manager).BuildHandlers
         0     0% 91.24%    76.05MB 53.03%  github.com/traefik/traefik/v2/pkg/server/router.(*Manager).buildEntryPointHandler
         0     0% 91.24%     1.50MB  1.05%  github.com/traefik/traefik/v2/pkg/server/router.(*Manager).buildHTTPHandler.func1
         0     0% 91.24%       36MB 25.11%  github.com/traefik/traefik/v2/pkg/server/router.(*Manager).buildRouterHandler
         0     0% 91.24%     3.50MB  2.44%  github.com/traefik/traefik/v2/pkg/server/router/tcp.(*Manager).buildEntryPointHandler.func1
         0     0% 91.24%       30MB 20.92%  github.com/traefik/traefik/v2/pkg/server/service.(*InternalHandlers).BuildHTTP
         0     0% 91.24%       30MB 20.92%  github.com/traefik/traefik/v2/pkg/server/service.(*Manager).BuildHTTP
         0     0% 91.24%       24MB 16.74%  github.com/traefik/traefik/v2/pkg/server/service.(*Manager).getLoadBalancer
         0     0% 91.24%    28.50MB 19.88%  github.com/traefik/traefik/v2/pkg/server/service.(*Manager).getLoadBalancerServiceHandler
         0     0% 91.24%       21MB 14.65%  github.com/traefik/traefik/v2/pkg/server/service.(*Manager).upsertServers
         0     0% 91.24%     1.50MB  1.05%  github.com/traefik/traefik/v2/pkg/server/service.(*ManagerFactory).Build
         0     0% 91.24%     4.54MB  3.16%  github.com/vulcand/oxy/roundrobin.(*RoundRobin).ServeHTTP
         0     0% 91.24%     1.50MB  1.05%  github.com/vulcand/predicate.(*predicateParser).Parse
         0     0% 91.24%     1.50MB  1.05%  go/parser.(*parser).expect
         0     0% 91.24%     1.50MB  1.05%  go/parser.(*parser).next
         0     0% 91.24%     1.50MB  1.05%  go/parser.(*parser).next0
         0     0% 91.24%     1.50MB  1.05%  go/parser.(*parser).parseBinaryExpr
         0     0% 91.24%     1.50MB  1.05%  go/parser.(*parser).parseCallOrConversion
         0     0% 91.24%     1.50MB  1.05%  go/parser.(*parser).parseExpr
         0     0% 91.24%     1.50MB  1.05%  go/parser.(*parser).parsePrimaryExpr
         0     0% 91.24%     1.50MB  1.05%  go/parser.(*parser).parseRhsOrType
         0     0% 91.24%     1.50MB  1.05%  go/parser.(*parser).parseUnaryExpr
         0     0% 91.24%     1.50MB  1.05%  go/parser.ParseExpr
         0     0% 91.24%     1.50MB  1.05%  go/parser.ParseExprFrom
         0     0% 91.24%     1.50MB  1.05%  go/scanner.(*Scanner).Scan
         0     0% 91.24%    11.07MB  7.72%  k8s.io/apimachinery/pkg/runtime.WithoutVersionDecoder.Decode
         0     0% 91.24%    11.07MB  7.72%  k8s.io/apimachinery/pkg/runtime/serializer/json.(*Serializer).Decode
         0     0% 91.24%     1.66MB  1.16%  k8s.io/client-go/informers/core/v1.NewFilteredEndpointsInformer.func1
         0     0% 91.24%     3.30MB  2.30%  k8s.io/client-go/informers/core/v1.NewFilteredServiceInformer.func1
         0     0% 91.24%     1.66MB  1.16%  k8s.io/client-go/kubernetes/typed/core/v1.(*endpoints).List
         0     0% 91.24%     3.30MB  2.30%  k8s.io/client-go/kubernetes/typed/core/v1.(*services).List
         0     0% 91.24%    10.57MB  7.37%  k8s.io/client-go/rest.Result.Into
         0     0% 91.24%    10.57MB  7.37%  k8s.io/client-go/tools/cache.(*ListWatch).List
         0     0% 91.24%    10.57MB  7.37%  k8s.io/client-go/tools/cache.(*Reflector).ListAndWatch.func1.1
         0     0% 91.24%    10.57MB  7.37%  k8s.io/client-go/tools/cache.(*Reflector).ListAndWatch.func1.1.2
         0     0% 91.24%     1.02MB  0.71%  k8s.io/client-go/tools/cache.(*sharedIndexInformer).AddEventHandler
         0     0% 91.24%     1.02MB  0.71%  k8s.io/client-go/tools/cache.(*sharedIndexInformer).AddEventHandlerWithResyncPeriod
         0     0% 91.24%     1.02MB  0.71%  k8s.io/client-go/tools/cache.newProcessListener
         0     0% 91.24%    10.57MB  7.37%  k8s.io/client-go/tools/pager.(*ListPager).List
         0     0% 91.24%    10.57MB  7.37%  k8s.io/client-go/tools/pager.SimplePageFunc.func1
         0     0% 91.24%    87.74MB 61.18%  main.switchRouter.func1
         0     0% 91.24%     2.51MB  1.75%  net/http.(*Transport).dialConn
         0     0% 91.24%     2.51MB  1.75%  net/http.(*Transport).dialConnFor
         0     0% 91.24%        3MB  2.09%  net/http.(*conn).serve
         0     0% 91.24%        1MB   0.7%  net/http.(*persistConn).addTLS.func2
         0     0% 91.24%     3.50MB  2.44%  net/http.HandlerFunc.ServeHTTP
         0     0% 91.24%        3MB  2.09%  net/http.serverHandler.ServeHTTP
         0     0% 91.24%     1.03MB  0.72%  net/http/httputil.(*ReverseProxy).ServeHTTP
         0     0% 91.24%     1.03MB  0.72%  net/http/httputil.(*ReverseProxy).copyBuffer
         0     0% 91.24%     1.03MB  0.72%  net/http/httputil.(*ReverseProxy).copyResponse
         0     0% 91.24%     1.50MB  1.05%  net/url.(*URL).String
         0     0% 91.24%    26.54MB 18.51%  regexp.Compile (inline)
         0     0% 91.24%    19.54MB 13.62%  regexp/syntax.(*compiler).compile
         0     0% 91.24%    19.54MB 13.62%  regexp/syntax.(*compiler).rune
         0     0% 91.24%     1.50MB  1.05%  regexp/syntax.(*parser).literal
         0     0% 91.24%        2MB  1.39%  regexp/syntax.(*parser).push
         0     0% 91.24%    22.54MB 15.72%  regexp/syntax.Compile
         0     0% 91.24%        2MB  1.39%  regexp/syntax.Parse
         0     0% 91.24%     1.51MB  1.05%  runtime.doInit
         0     0% 91.24%     1.51MB  1.05%  runtime.main
         0     0% 91.24%        1MB   0.7%  runtime.mstart
         0     0% 91.24%        1MB   0.7%  runtime.newproc.func1
         0     0% 91.24%        1MB   0.7%  runtime.newproc1
         0     0% 91.24%        1MB   0.7%  runtime.systemstack
         0     0% 91.24%        1MB   0.7%  strings.(*Builder).Grow (inline)
         0     0% 91.24%        1MB   0.7%  strings.Join
Here are the OS memory stats very shortly before one of the 2.2.11 containers died:
OS memory stats
cache 0
rss 0
rss_huge 0
shmem 0
mapped_file 0
dirty 0
writeback 0
swap 0
pgpgin 0
pgpgout 0
pgfault 0
pgmajfault 0
inactive_anon 0
active_anon 0
inactive_file 0
active_file 0
unevictable 0
hierarchical_memory_limit 1625292800
hierarchical_memsw_limit 9223372036854771712
total_cache 135168
total_rss 1575972864
total_rss_huge 23068672
total_shmem 0
total_mapped_file 135168
total_dirty 0
total_writeback 0
total_swap 0
total_pgpgin 394944
total_pgpgout 27532
total_pgfault 487740
total_pgmajfault 0
total_inactive_anon 0
total_active_anon 328388608
total_inactive_file 1247752192
total_active_file 192512
total_unevictable 0
here is one of the 2.2.11 kill events:
[121429.699871] traefik invoked oom-killer: gfp_mask=0x14000c0(GFP_KERNEL), nodemask=(null),  order=0, oom_score_adj=805
[121429.708965] traefik cpuset=320408be6d1ac733cbdc3a3c08644af24878d1fdc02df8021b38da44f7338e98 mems_allowed=0
[121429.717409] CPU: 0 PID: 22195 Comm: traefik Not tainted 4.14.214-160.339.amzn2.x86_64 #1
[121429.724945] Hardware name: Amazon EC2 m5.large/, BIOS 1.0 10/16/2017
[121429.730158] Call Trace:
[121429.733251]  dump_stack+0x66/0x82
[121429.736889]  dump_header+0x94/0x229
[121429.740700]  oom_kill_process+0x223/0x440
[121429.744814]  out_of_memory+0x112/0x4d0
[121429.748619]  mem_cgroup_out_of_memory+0x49/0x80
[121429.752834]  mem_cgroup_oom_synchronize+0x2ed/0x330
[121429.757145]  ? mem_cgroup_css_reset+0xd0/0xd0
[121429.761184]  pagefault_out_of_memory+0x32/0x77
[121429.765151]  __do_page_fault+0x4b4/0x4c0
[121429.768567]  ? async_page_fault+0x2f/0x50
[121429.772048]  async_page_fault+0x45/0x50
[121429.775445] RIP: 0000:0x2e00ee9
[121429.778528] RSP: 0000:000000c00552a8d0 EFLAGS: 000000f3
[121429.778561] Task in /kubepods/burstable/podf3acb462-ca91-4b45-8a5d-8607156b865d/320408be6d1ac733cbdc3a3c08644af24878d1fdc02df8021b38da44f7338e98 killed as a result of limit of /kubepods/burstable/podf3acb462-ca91-4b45-8a5d-8607156b865d/320408be6d1ac733cbdc3a3c08644af24878d1fdc02df8021b38da44f7338e98
[121429.801310] memory: usage 1536000kB, limit 1536000kB, failcnt 0
[121429.805835] memory+swap: usage 1536000kB, limit 1536000kB, failcnt 66
[121429.810629] kmem: usage 5440kB, limit 9007199254740988kB, failcnt 0
[121429.815239] Memory cgroup stats for /kubepods/burstable/podf3acb462-ca91-4b45-8a5d-8607156b865d/320408be6d1ac733cbdc3a3c08644af24878d1fdc02df8021b38da44f7338e98: cache:0KB rss:1530456KB rss_huge:4096KB shmem:0KB mapped_file:0KB dirty:0KB writeback:0KB swap:0KB inactive_anon:0KB active_anon:1530560KB inactive_file:0KB active_file:0KB unevictable:0KB
[121429.836960] [ pid ]   uid  tgid total_vm      rss nr_ptes nr_pmds swapents oom_score_adj name
[121429.844266] [22163]     0 22163   560456   393339     797       6        0           805 traefik
[121429.851509] Memory cgroup out of memory: Kill process 22163 (traefik) score 1831 or sacrifice child
[121429.858960] Killed process 22163 (traefik) total-vm:2241824kB, anon-rss:1529776kB, file-rss:43580kB, shmem-rss:0kB
[121429.956848] oom_reaper: reaped process 22163 (traefik), now anon-rss:0kB, file-rss:0kB, shmem-rss:0kB
Does anything in the setup look suspicious? Could it be normal given the cluster size (in that it would plateau at some point)? My working theory was that this happens during node churn (directly or indirectly), but it doesn’t always match. I also found an interesting article here: https://www.bwplotka.dev/2019/golang-memory-monitoring/, not sure if it applies in any capacity to this case, but even if it does, RSS is what the OOM killer (also) looks at, so I don’t want to just remove the limits.
About this issue
- Original URL
- State: closed
- Created 3 years ago
- Reactions: 2
- Comments: 30 (5 by maintainers)
This update fixed our memory leak issue with Traefik in regards to large churn on
IngressRoutes.Hi,
Thanks for the update and investigation! I’ll give this version a go, just need to go through the 2.4-2.5 changelog in case the setup needs to be adjusted.
I’ve rolled out 2.5.7 (up from 2.4.6) to prod so I’ll keep an eye on the memory consumption. I saw in the other issue that the fixes didn’t quite help, we’ll see here. So far it’s looking like this: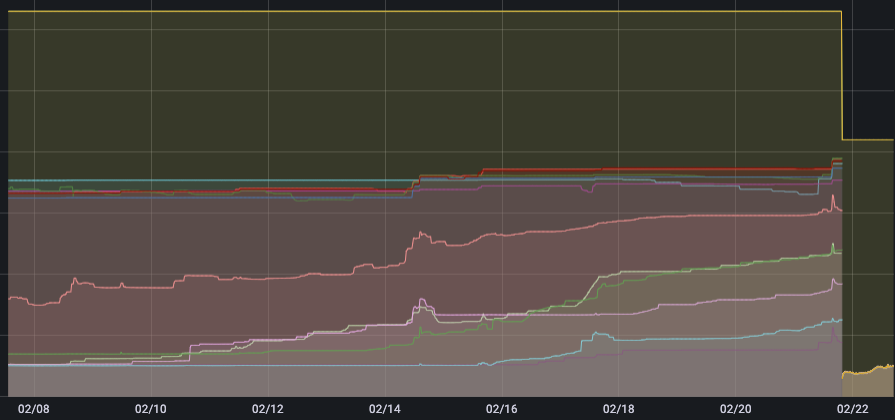
@krzysztof-bronk
Hi, we were able to reproduce a memory leak, even though we cannot be certain that it is the same as the one you’re seeing. After some investigation, we pinpointed a place in the code where we could have an influence on it, which lead to https://github.com/traefik/traefik/pull/8706 . We are quite sure that this is not the final fix, but we decided that for now it is an acceptable work-around, as it seems to drastically reduce the leak, without any negative side-effect.
As this change is now already included in the experimental image of v2.5 (experimental-v2.5,
docker pull traefik/traefik:experimental-v2.5), would you mind trying it out to see if it helps with your issue as well please?