traefik: High CPU usage on traefik v2 compared to v1
Do you want to request a feature or report a bug?
Bug
What did you do?
Migrating a chunk of traffic from traefik v1.7.14 to v2.2.0, we noticed that the latter uses a lot more CPU, so we decided to investigate a little bit deeper.
Output of traefik version: (What version of Traefik are you using?)
See above.
What is your environment & configuration (arguments, toml, provider, platform, …)?
The testing setup
In order to try to understand the issue here, we used the following setup:
Two traefik kubernetes Deployments of 9 replicas, each with the following resource configuration:
resources:
  limits:
    cpu: 2000m
    memory: 2000Mi
  requests:
    cpu: 250m
    memory: 250Mi
Both traefik Deployments are behind a NodePort type Service, behind an AWS Network Load Balancer.
The cluster where they are hosted is generally not doing much besides log and metrics collection. It does not receive external traffic (or at least the amount of traffic it may occassionally receive is negligible) and is not running an resource-hungry processes. Essentially, traefik should be able to reach the limits of its resource allocation.
The traffic we used on these two traefik Deployments was mirrored from the environment where we initially noticed the issue.
Traefik configuration
traefik v1:
args:
  - --debug
  - --api
  - --api.entryPoint=system
  - --ping
  - --ping.entryPoint=system
  - --metrics
  - --metrics.prometheus
  - --metrics.prometheus.entryPoint=system
  - --logLevel=ERROR
  - --kubernetes
  - --kubernetes.labelselector=kubernetes.io/ingress.class=traefik-public-tls
  - --entryPoints=Name:http Address::80
  - --entryPoints=Name:https Address::443 TLS
  - --entryPoints=Name:system Address::8080
  - --defaultentrypoints=http,https
traefik v2:
args:
  - --api.insecure=true
  - --api.debug=true
  - --ping
  - --metrics.prometheus
  - --log.level=ERROR
  - --providers.kubernetescrd.labelselector=kubernetes.io/ingress.class=traefik-public-v2
  - --providers.kubernetesingress.labelselector=kubernetes.io/ingress.class=traefik-public-v2
  - --entryPoints.web.address=:80
  - --entryPoints.web-secure.address=:443
  - --entryPoints.web-secure.http.tls=true
  - --entryPoints.traefik.address=:8080
What did you expect to see?
We expected to see comparable resource usage between the v1 and v2 traefik Deployments.
What did you see instead?
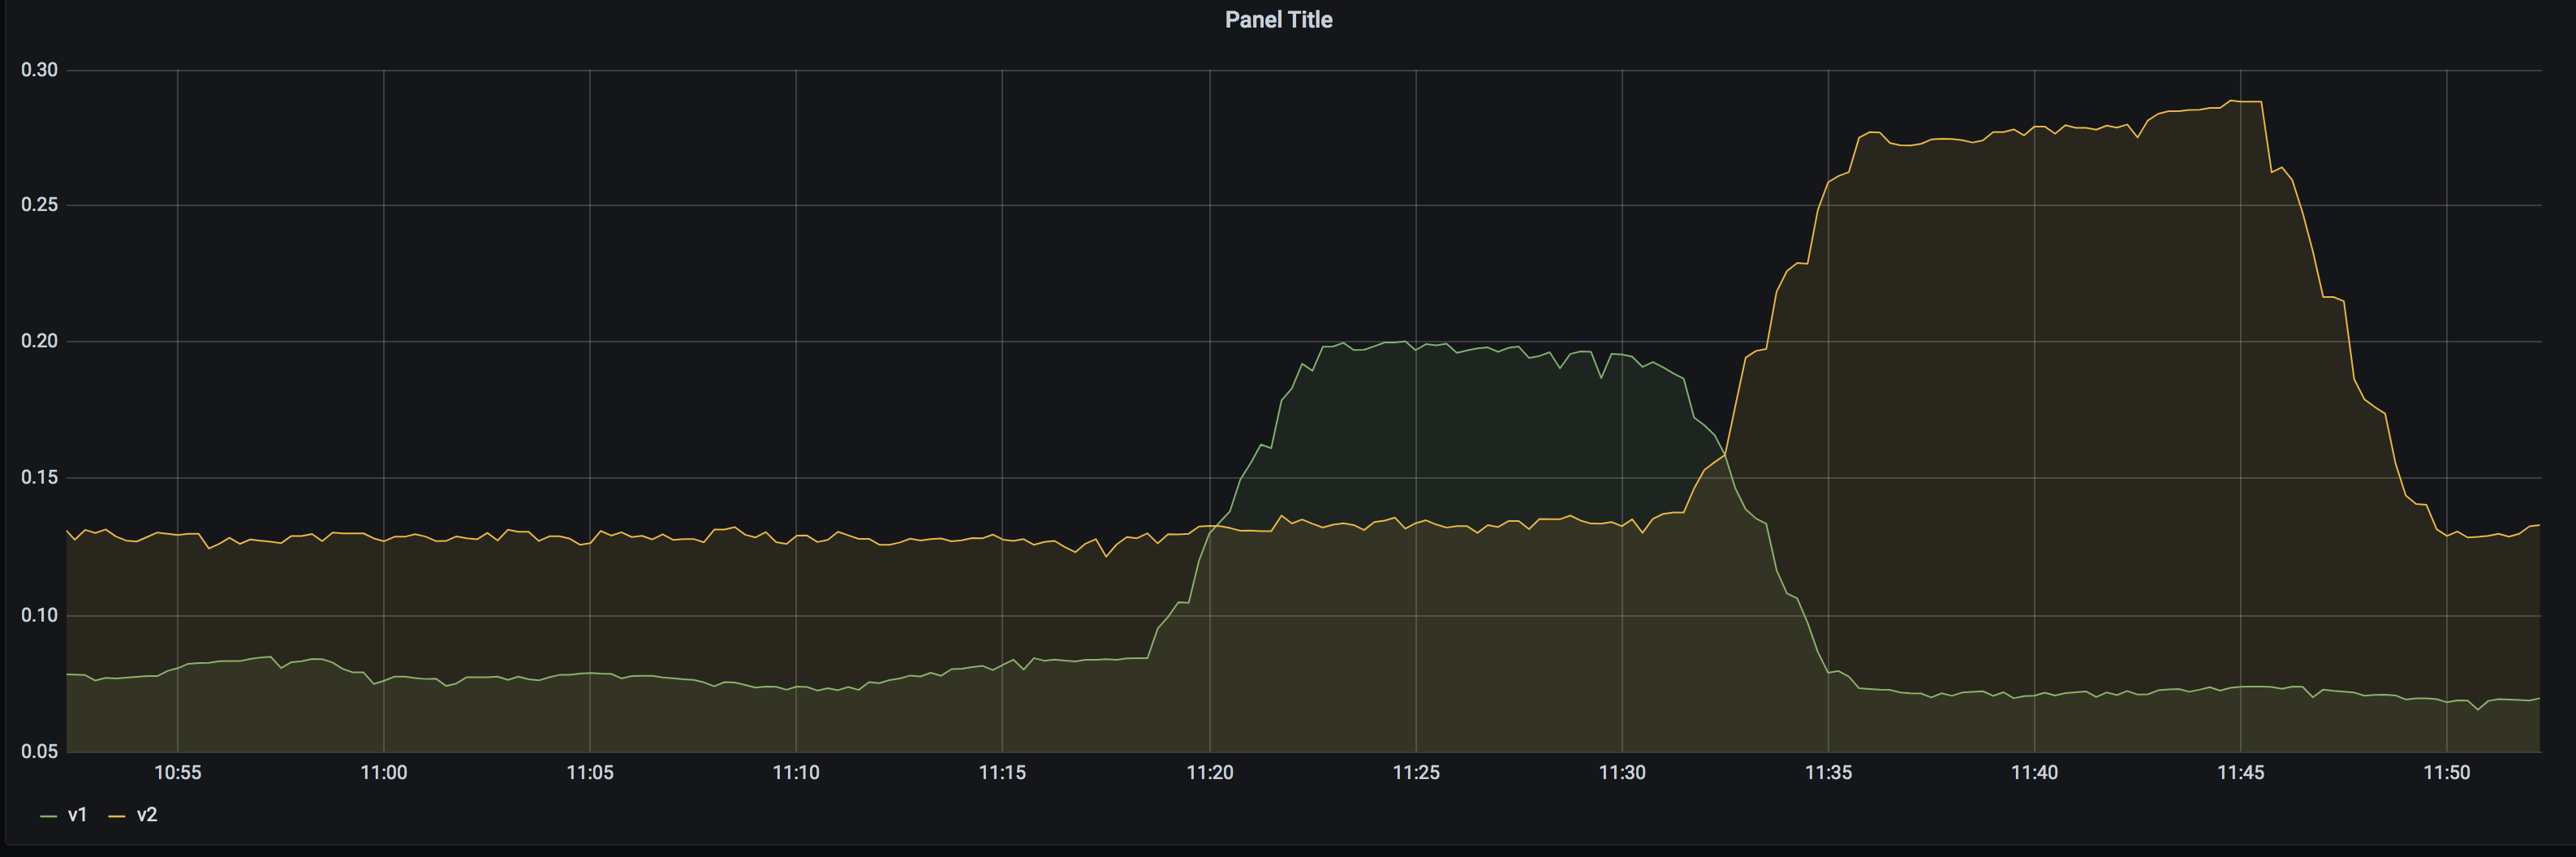
Instead, we noticed that traefik v2 was using considerably more CPU, compared to v1.
Additionally, while tailing the logs of the traffic generating processes, we noticed that using the v2 Ingresses resulted in noticably more 504 responses when the system was stressed and that v2 traefiks were more likely to restart as a result. However, this could have been due to the increased CPU usage, throttling from docker etc.
For comparison, see the following graphs and profiles:
(graphs show the sum(rate(container_cpu_usage_seconds_total)) of all traefik containers)
-
http:
-
https (rsa):

-
https (rsa vs ecdsa): Using an ECDSA certificate past the dip at 14:15 doesn’t seem to have much of an effect:

About this issue
- Original URL
- State: closed
- Created 4 years ago
- Reactions: 18
- Comments: 54 (20 by maintainers)
Any update on this ?
I’ve enabled the debug api endpoints as per the suggestion from @dtomcej and here’s everything: traefik-debug.zip
The profile looks like there something wrong somewhere, but I’m not quite sure why that is the case - 11s in a syscall doesn’t seem right:
Problem still exists in Traefik 2.9.4 with digitalocean’s
2vcpu(shared)/4g ramdroplet.I collected some metrics about this, maybe someone can make sense of them:
The obvious spike in cpu usage:
However, memory didn’t went up:
There were quite a lot of interrupts:
And way more network traffic - I can’t say if that was docker-internal or external:
Traefik latency also went up:
I’m not sure if that’s because traefik was clogging the cpu or other reasons.
Open connections didn’t increase - that could also be an error in the logs collected since the system was kept busy by traefik at the time:
But the usage of sockets increased over time - this correlates with the usage of more network resources despite not many requests served in that period:
Any update on this? I experience the same thing.
Same problem exists in Traefik v2.10.1 with docker.
@3nprob sorry for the inconvenience, this is really an auto action for issues without activity and labeled as waiting for feedback, which was not correct on this one 😃
I’m reopening it and closing the new one as duplicate, better to keep everything here.
By the way, if you’re still experiencing this on the latest version please share with us your configuration and CPU profile if possible.
Hey, I observed the exact issues with CPU using 2.2.0 version. The only fix we could do is to recreate the pods.
I’ve been seeing this as well with v2.2.0, to the point that the container flattens the host within 5 minutes of exposing it to the internet and it starts getting even tiny amounts of “real” traffic.
You can follow my previous comment: https://github.com/traefik/traefik/issues/6954#issuecomment-773572813
This is not true: we already fixed several elements related to CPU consumption and performance.
The problems here are the issue itself, and being able to have something to diagnose.
We spent a lot of time analyzing pproof reports, and we have fixed what we found. But it’s a complex and time-consuming task.
The original topic was the difference between v1 and v2 (at some point it can be expected), but comments drifted on the subject of CPU consumption in general, and with messages like “I have the same problem” but without information to reproduce and diagnose or being able to know if the problems are related.
This issue is now impossible to fix. I think we should close this issue, not because the problems expressed inside the issue are fixed, but just because this issue contains multiple things. And suggest opening new issues for each person.
@ddtmachado thanks for attending it promptly.
We do still see it on 2.7.0, will see if we can get a profile in.
(BTW for the future maybe it’s worth reformulating the message in the bot if kept around as its currently instructing participants to open duplicates which you seem to agree is not ideal for tracking issues over time. What seems to work best for projects who declare issue-bankruptcy is the bot commenting “I’m going to auto-close this in 30 days unless further activity on the issue”, giving a reasonable time-window for participants to keep it open by bumping it)
@MrOwen reverting to 2.3 does work? Are you using TRAEFIK_PING? Because I notice would be related to that feature
@dtomcej so I’ve done a bit of digging, and seems that the problem is an inifite loop with the message
msg="vulcand/oxy/roundrobin/rr: Forwarding this request to URL". This happens when I go to a route that seems to be misconfigured (indeed I didn’t get things right yet). So probably a very different case than what others have reported in this specific issue. This is my latest test with v2.1, but same behaviour in 2.2 and latest.Traefik Setup
*I just added the resource limits (there wasn't any before)Container Setup
What I was trying to achieve was: when you hit `api.example.com/flower` traefik would redirect the request to service named `flower`, that is exposed on port 8888. Obviously that didn't work out.The logs
As soon as I hit `/flower` I get thousands of log messages like this, than everything breaks, memory hits 100%, and I can't even see the CPU evolution anymore since I'm kicked out of SSH and the server crashes completely.We also observed a massive increase in CPU load when going from traefik 2.1.6 to 2.2.1 or 2.2.7. CPU usage increased by a factor of ~5. We’re running a kind of special traefik instance here, which handles a large number of plain TCP connections with mTLS (configured through Kubernetes SD with
ingressroutetcpsandtlsoptions. We downgraded to 2.1.x again.Jens Erat jens.erat@daimler.com, Daimler TSS GmbH
Imprint