traefik: High CPU usage
Do you want to request a feature or report a bug?
bug
What did you do?
When using traefik in front of dynamic web applications (e.g. nextcloud, speedtest) i see very high cpu usage up to 100%, when data is transferred (e.g. large downloads or speedtests).
Note: traefik and web apps run both in docker swarm
Update 1: disable compression on entrypoint. cpu usage still at 50-60% - is this expected?
What did you expect to see?
no cpu spikes (e.g. like general load balancers / reverse proxies)
What did you see instead?
cpu rises up to 100% cpu load
Output of traefik version: (What version of Traefik are you using?)
Version:      v1.4.5
Codename:     roquefort
Go version:   go1.9.2
Built:        2017-12-06_10:16:48AM
OS/Arch:      linux/amd64
What is your environment & configuration (arguments, toml, provider, platform, …)?
services:
  traefik:
    image: ${IMAGE}:${RELEASE}
    environment:
      ACME_EMAIL: ${ACME_EMAIL}
      ACME_DEFAULT_HOST: ${ACME_DEFAULT_HOST}
    command:
      - --configfile=/run/secrets/traefik_admin
      - --loglevel=WARN
      - --checknewversion=false
      - --insecureskipverify=true
      - --defaultentrypoints=http,https
      - "--entrypoints=Name:http Address::80 Compress:true Redirect.EntryPoint:https"
      - "--entryPoints=Name:https Address::443 TLS Compress:true"
      - --acme
      - --acme.email=${ACME_EMAIL}
      - --acme.domains=${ACME_DEFAULT_HOST}
      - --acme.onhostrule
      - --acme.entrypoint=https
      - --acme.storage=/data/acme.json
      - --docker
      - --docker.watch
      - --docker.exposedbydefault=false
      - --docker.swarmmode
      # - --debug
    networks:
     - traefik
    ports:
      - target: 80
        published: 80
        protocol: tcp
        mode: host
      - target: 443
        published: 443
        protocol: tcp
        mode: host
    volumes:
      - /var/run/docker.sock:/var/run/docker.sock:ro
      - traefik:/data
    healthcheck:
      test: ["CMD-SHELL", "traefik healthcheck --web"]
      interval: 30s
      timeout: 5s
      retries: 2
      start_period: 30s
    deploy:
      restart_policy:
        condition: any
        delay: 2s
      update_config:
        monitor: 120s
        failure_action: continue
      labels:
        - "traefik.enable=true"
        - "traefik.docker.network=org_traefik"
        - "traefik.port=8080"
        - "traefik.protocol=http"
        - "traefik.frontend.rule=Host:${ACME_DEFAULT_HOST};PathPrefixStrip:/traefik"
    secrets:
      - traefik_admin
If applicable, please paste the log output in debug mode (--debug switch)
(paste your output here)
About this issue
- Original URL
- State: closed
- Created 6 years ago
- Reactions: 9
- Comments: 37 (16 by maintainers)
Things have gotten worse in 1.6, I wish you would give more love towards performance soon, because it is not that far away till your space is overtaken by Envoy or some Nginx cloud-native advancements.
Ok I see, so right now we increased the limit to 100Mi, but we will have to monitor if this is enough for our application. I am happy though that at least now we have a logical explanation for this weird behavior we’ve been seeing.
You’re right, high cpu usage due to slow handshakes with default RSA4096 cert in traefik, check golang issue https://github.com/golang/go/issues/20058 . I change keytype to ECDSA “–acme.keytype=EC256” and cpu usage back to normal.
This memory limit in the helm chart is a pretty painful default – your team is not the first one that has been hurt by it. I tried to lobby a change in the chart values a while ago, but no luck to this date.
Now, given that the official helm chart is maintained by traefik team directly, feel free to propose a change in the defaults if you agree with me that this is reasonable. IMO the compound time spent on upgrading from chart v1 to v2 is far less than the effort needed to tackle this IO nightmare people randomly enter. It took me a while to figure out why traefik started killing my CPU, I felt desperate during the investigation 😞
If someone posts some instructions I’d be happy to do some profiling.
Hi @tboerger , the Traefik 2.0 GA version don’t have this behaviour as far as we know (reference: #5294 was closed during the RC phase).
As this issue is old and hijacked by a lot of different users, we are closing it for triage cleanup.
Please feel free to open new issues with reproduction case if you are still having this behavior with latest Traefik v2.0. Thanks!
The issue is not specific to compression, it’s about resource usage in general. When you have compression, https, high load or any other resource-consuming factor, traefik goes over the default 20MiB ram limit and starts endlessly writing and reading from swap.
IMO the problem is that chart defaults are not picked correctly and this causes CPU madness in pretty standard conditions. I was in favor of changing the defaults and thus upgrading the chart to v2, but this proposal has not been accepted.
The result is that new traefik chart users fall into the same trap as me a year ago.
Thank you very much for this information. We’ve updated our memoryLimit in the helm chart to 100Mi and will see in the coming days!
We have recently upgraded to Traefik version 1.6.4 and the CPU usage increased dramatically.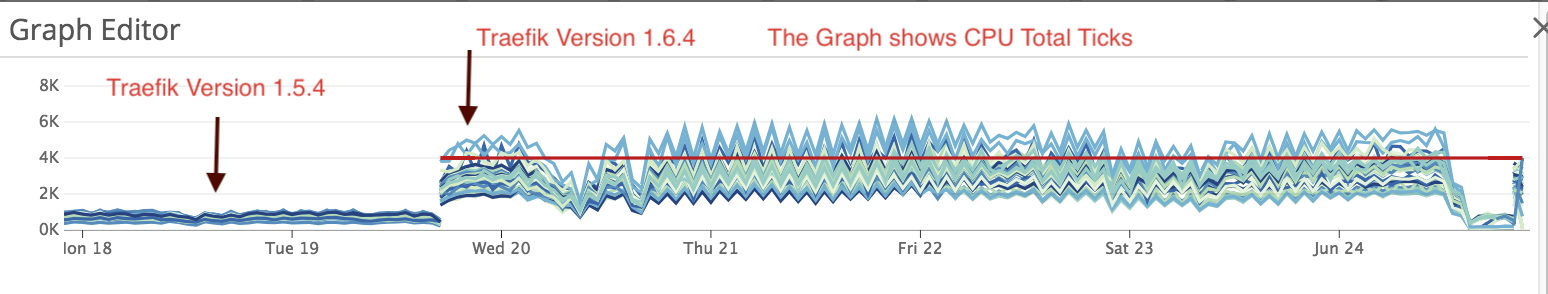
Similar here. Traefik consumes more CPU than the backend PHP app and almost the same as MySQL.
I have observed this behavior since I started using Traefik at 1.3.x, it seems to be even a bit worse at 1.5.4
All static files are hosted by a CDN and the site is not using a full page cache.
When I attach strace, most of the output is:
Total times:
Done the profiling on a test machine (cloud scaleway VC1S instance 2 core Intel Atom C2750 @ 2.40GHz) with traefik 1.5.3 running on docker (using siege with 50 concurrent users), cpu usage 44% on node with traefik container, only 5% on the node serving the actual content.
profile.zip
My docker-compose
I retested with 1.5.0 and got similar cpu metrics.