cellrank: incorrect visualization of initial states
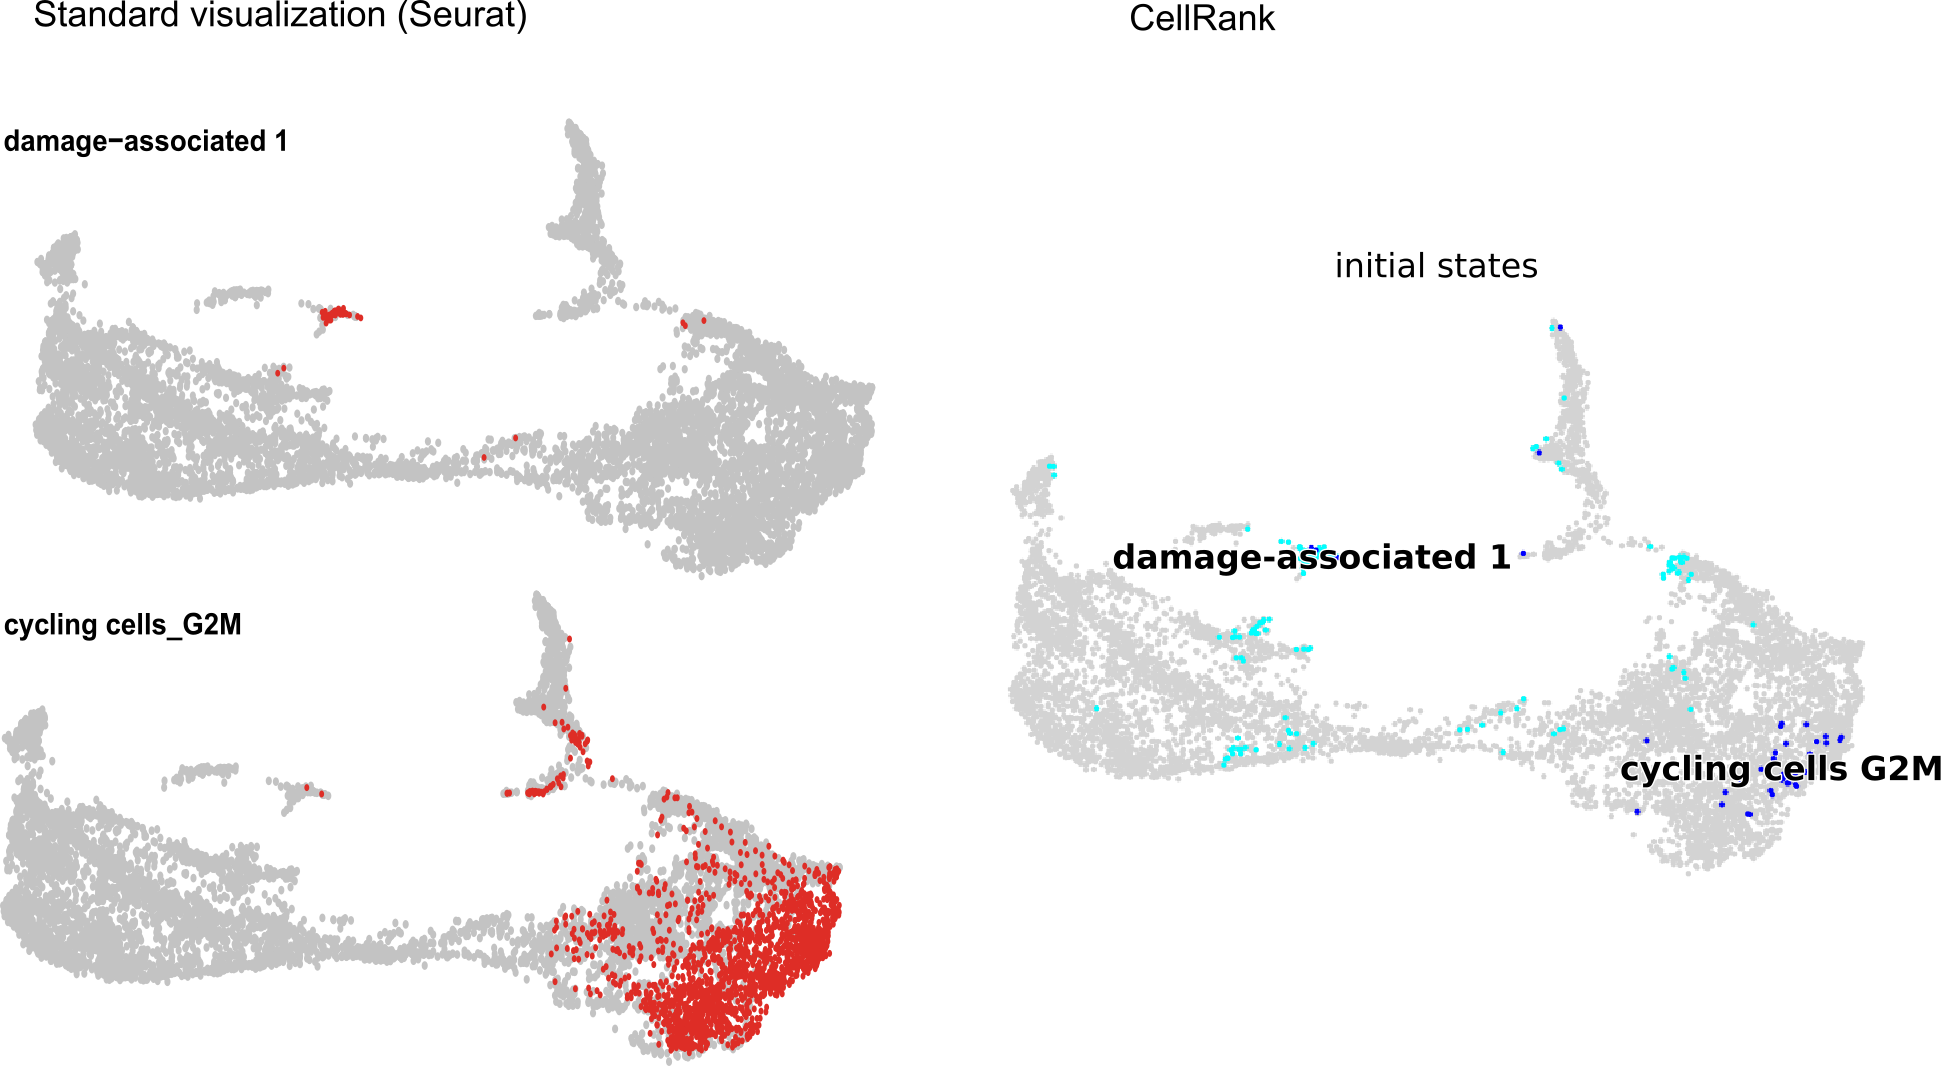
Cellrank incorrectly visualizes the location of cells in the ‘initial states’ calculation. I have attached an example of the location of two clusters identified as initial states by cellrank. At left is a standard visualization of the individual clusters using the DimPlot function in Seurat. At right is the visualization of the same clusters by cellrank. There are only 69 damage-associated 1 cells and they are mostly found in a well-defined spot in the standard umap visualization. Cellrank visualizes what appears to be a much larger number of cells as damage-associated 1, and they are dispersed all over the map. It also displays a much smaller number of cycling cells_G2M, though they are in the correct location on the map.
This incorrect visualization of the cells identified as initial states does not give me confidence that the identification is correct.
When running the code below, cellrank also returns the warning: "The following states could not be mapped uniquely: ['cycling cells_G2M', 'damage-associated 1']
adata = adata_d[sample]
cr.tl.initial_states(adata, cluster_key=anno, n_jobs=20,
                     estimator=cr.tl.estimators.CFLARE,
                     n_states = init_states[sample], weight_connectivities = wc)
cr.pl.initial_states(adata, basis=basis, discrete=True,
                     save='_'.join((sample,mode,basis,anno)) + '_cr_initial_states.pdf')
Versions:
cellrank==1.4.0 scanpy==1.7.2 anndata==0.7.6 numpy==1.21.0 numba==0.52.0 scipy==1.7.0 pandas==1.3.0 pygpcca==1.0.2 scikit-learn==0.24.2 statsmodels==0.12.2 python-igraph==0.9.1 scvelo==0.2.3 pygam==0.8.0 matplotlib==3.4.2 seaborn==0.11.1
About this issue
- Original URL
- State: closed
- Created 3 years ago
- Comments: 20
Fyi - This issue doesn’t occur with the dev branch!