spinnaker: OutOfMemoryError for orca despite 80gb heap
Issue Summary:
We have been seeing an issue where all of a sudden Orca is using all of the Java heap available to it. We started with a heap size of 3gb, doubled it a few times, and are now using -Xmx80g. It seems like immediately after Orca starts up it very rapidly uses up the entire heap. Eventually all of the CPU time is spent in garbage collection, causing timeouts when Gate tries to communicate with Orca (for example to trigger a pipeline). Eventually Orca will exit since we have configured -XX:+ExitOnOutOfMemoryError.
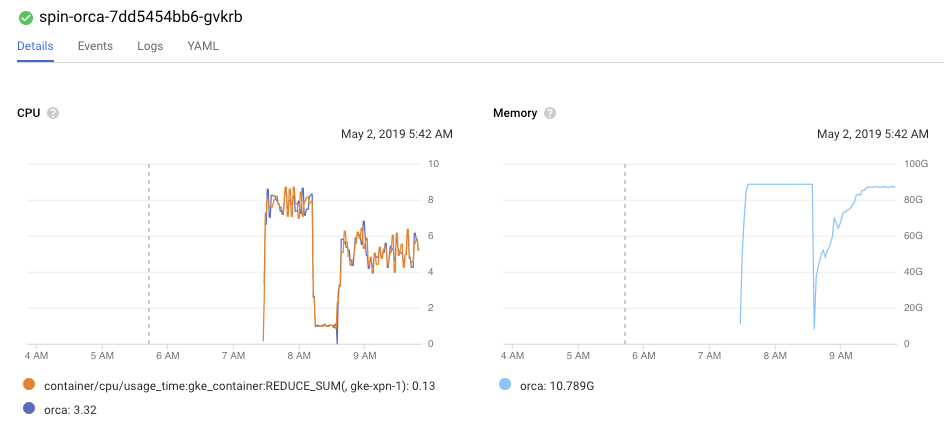
In the graph above, Orca is deployed as a Kubernetes pod with
        requests:
          cpu: 8
          memory: 100Gi
Immediately after the pod is created, the memory usage spikes to ~80gb range (because of -Xmx80g), and Orca is using all of its CPU. The drop in the memory/CPU usage in the graph corresponds to the process exiting (-XX:+ExitOnOutOfMemoryError) and the container being recreated by the kubelet - the second instance of the container does not grow in heap usage as immediately fast as the first, but still grows rapidly.
jstat shows the survivor, eden, and old generation spaces completely full:
bash-4.4# jstat -gc 1 2s 200
 S0C    S1C    S0U    S1U      EC       EU        OC         OU       MC     MU    CCSC   CCSU   YGC     YGCT    FGC    FGCT     GCT
9320448.0 9320448.0  0.0    0.0   9320960.0 9320960.0 55924224.0 55924021.6 76800.0 73978.8  0.0    0.0       45  144.146  37   1026.468 1170.615
9320448.0 9320448.0  0.0    0.0   9320960.0 9320960.0 55924224.0 55924021.6 76800.0 73978.8  0.0    0.0       45  144.146  37   1026.468 1170.615
9320448.0 9320448.0  0.0    0.0   9320960.0 9320960.0 55924224.0 55924021.6 76800.0 73978.8  0.0    0.0       45  144.146  37   1026.468 1170.615
9320448.0 9320448.0  0.0    0.0   9320960.0 9320960.0 55924224.0 55924021.6 76800.0 73978.8  0.0    0.0       45  144.146  37   1026.468 1170.615
9320448.0 9320448.0  0.0    0.0   9320960.0 9320960.0 55924224.0 55924021.6 76800.0 73978.8  0.0    0.0       45  144.146  37   1026.468 1170.615
9320448.0 9320448.0  0.0    0.0   9320960.0 9320960.0 55924224.0 55924021.6 76800.0 73978.8  0.0    0.0       45  144.146  37   1026.468 1170.615
9320448.0 9320448.0  0.0    0.0   9320960.0 9320960.0 55924224.0 55924021.6 76800.0 73978.8  0.0    0.0       45  144.146  37   1026.468 1170.615
9320448.0 9320448.0  0.0    0.0   9320960.0 9320960.0 55924224.0 55924021.6 76800.0 73978.8  0.0    0.0       45  144.146  37   1026.468 1170.615
9320448.0 9320448.0  0.0    0.0   9320960.0 9320960.0 55924224.0 55924021.6 76800.0 73978.8  0.0    0.0       45  144.146  37   1026.468 1170.615
9320448.0 9320448.0  0.0    0.0   9320960.0 9320960.0 55924224.0 55924021.3 76800.0 73978.8  0.0    0.0       45  144.146  38   1091.482 1235.629
9320448.0 9320448.0  0.0    0.0   9320960.0 9320960.0 55924224.0 55924021.3 76800.0 73978.8  0.0    0.0       45  144.146  38   1091.482 1235.629
9320448.0 9320448.0  0.0    0.0   9320960.0 9320960.0 55924224.0 55924021.3 76800.0 73978.8  0.0    0.0       45  144.146  38   1091.482 1235.629
9320448.0 9320448.0  0.0    0.0   9320960.0 9320960.0 55924224.0 55924021.3 76800.0 73978.8  0.0    0.0       45  144.146  38   1091.482 1235.629
9320448.0 9320448.0  0.0    0.0   9320960.0 9320960.0 55924224.0 55924021.3 76800.0 73978.8  0.0    0.0       45  144.146  38   1091.482 1235.629
9320448.0 9320448.0  0.0    0.0   9320960.0 9320960.0 55924224.0 55924021.3 76800.0 73978.8  0.0    0.0       45  144.146  38   1091.482 1235.629
9320448.0 9320448.0  0.0    0.0   9320960.0 9320960.0 55924224.0 55924021.3 76800.0 73978.8  0.0    0.0       45  144.146  38   1091.482 1235.629
9320448.0 9320448.0  0.0    0.0   9320960.0 9320960.0 55924224.0 55924021.3 76800.0 73978.8  0.0    0.0       45  144.146  38   1091.482 1235.629
9320448.0 9320448.0  0.0    0.0   9320960.0 9320960.0 55924224.0 55924021.3 76800.0 73978.8  0.0    0.0       45  144.146  38   1091.482 1235.629
9320448.0 9320448.0  0.0    0.0   9320960.0 9320960.0 55924224.0 55924021.3 76800.0 73978.8  0.0    0.0       45  144.146  38   1091.482 1235.629
9320448.0 9320448.0  0.0    0.0   9320960.0 9320960.0 55924224.0 55924021.3 76800.0 73978.8  0.0    0.0       45  144.146  38   1091.482 1235.629
9320448.0 9320448.0  0.0    0.0   9320960.0 9320960.0 55924224.0 55924021.3 76800.0 73978.8  0.0    0.0       45  144.146  39   1113.593 1257.739
9320448.0 9320448.0  0.0    0.0   9320960.0 9320960.0 55924224.0 55924021.3 76800.0 73978.8  0.0    0.0       45  144.146  39   1113.593 1257.739
9320448.0 9320448.0  0.0    0.0   9320960.0 9320960.0 55924224.0 55924021.3 76800.0 73978.8  0.0    0.0       45  144.146  39   1113.593 1257.739
9320448.0 9320448.0  0.0    0.0   9320960.0 9320960.0 55924224.0 55924021.3 76800.0 73978.8  0.0    0.0       45  144.146  39   1113.593 1257.739
Cloud Provider(s):
We deploy Spinnaker on GKE, master version 1.11.8-gke.6 and node version 1.11.7-gke.12. The resource request of the Orca pod is above.
Environment:
Spinnaker is deployed to Kubernetes via Halyard version 1.12.5. Orca is at version gcr.io/spinnaker-marketplace/orca:2.4.0-20190308182538.
Our Spinnaker instance has a single pipeline that deploys Kubernetes manifests to one of 15 GKE clusters (each is added as an account in Spinnaker, so there are 15 accounts). The pipeline is triggered with an argument that is the name of the GKE cluster to deploy to, and the pipeline has a conditional on each cluster to only deploy to the selected one. Each GKE cluster is at the same master/node version mentioned above.
We run Redis on a GCE instance outside of Kubernetes, at version 5:4.0.9-1ubuntu0.1. We do not use the SQL options for Orca’s persistence. Some possibly interesting stats from the redis-cli info command:
# Server
redis_version:4.0.9
redis_git_sha1:00000000
redis_git_dirty:0
redis_build_id:76095d16786fbcba
redis_mode:standalone
os:Linux 4.15.0-1029-gcp x86_64
arch_bits:64
multiplexing_api:epoll
atomicvar_api:atomic-builtin
gcc_version:7.3.0
process_id:8145
run_id:f2ec851105f1f1d472cc8aa02fe3800eb3ee7210
tcp_port:6379
uptime_in_seconds:76722
uptime_in_days:0
hz:10
lru_clock:13301520
executable:/usr/bin/redis-server
config_file:/etc/redis/redis.conf

# Clients
connected_clients:48
client_longest_output_list:0
client_biggest_input_buf:0
blocked_clients:0

# Memory
used_memory:4560737864
used_memory_human:4.25G
used_memory_rss:5111205888
used_memory_rss_human:4.76G
used_memory_peak:4562860264
used_memory_peak_human:4.25G
used_memory_peak_perc:99.95%
used_memory_overhead:10992833
used_memory_startup:273544
used_memory_dataset:4549745031
used_memory_dataset_perc:99.76%
total_system_memory:27389468672
total_system_memory_human:25.51G
used_memory_lua:87040
used_memory_lua_human:85.00K
maxmemory:0
maxmemory_human:0B
maxmemory_policy:noeviction
mem_fragmentation_ratio:1.12
mem_allocator:jemalloc-3.6.0
active_defrag_running:0
lazyfree_pending_objects:0

# Persistence
loading:0
rdb_changes_since_last_save:17624
rdb_bgsave_in_progress:0
rdb_last_save_time:1556805357
rdb_last_bgsave_status:ok
rdb_last_bgsave_time_sec:40
rdb_current_bgsave_time_sec:-1
rdb_last_cow_size:38006784
aof_enabled:0
aof_rewrite_in_progress:0
aof_rewrite_scheduled:0
aof_last_rewrite_time_sec:-1
aof_current_rewrite_time_sec:-1
aof_last_bgrewrite_status:ok
aof_last_write_status:ok
aof_last_cow_size:0

# Stats
total_connections_received:2495
total_commands_processed:121573332
instantaneous_ops_per_sec:2958
total_net_input_bytes:41279502138
total_net_output_bytes:8040429303769
instantaneous_input_kbps:2891.43
instantaneous_output_kbps:304272.94
rejected_connections:0
sync_full:0
sync_partial_ok:0
sync_partial_err:0
expired_keys:285718
expired_stale_perc:0.51
expired_time_cap_reached_count:0
evicted_keys:0
keyspace_hits:55060758
keyspace_misses:58215213
pubsub_channels:0
pubsub_patterns:3
latest_fork_usec:163824
migrate_cached_sockets:0
slave_expires_tracked_keys:0
active_defrag_hits:0
active_defrag_misses:0
active_defrag_key_hits:0
active_defrag_key_misses:0

# Replication
role:master
connected_slaves:0
master_replid:f3cfc63310bb2b15cf336da1d82f3b11dd459dbb
master_replid2:0000000000000000000000000000000000000000
master_repl_offset:0
second_repl_offset:-1
repl_backlog_active:0
repl_backlog_size:1048576
repl_backlog_first_byte_offset:0
repl_backlog_histlen:0

# CPU
used_cpu_sys:5194.31
used_cpu_user:6772.37
used_cpu_sys_children:920.36
used_cpu_user_children:8534.84

# Cluster
cluster_enabled:0

# Keyspace
db0:keys=163934,expires=9953,avg_ttl=19024940
Any tips or ideas into what we can look into to understand why Orca is consuming so much memory so fast?
About this issue
- Original URL
- State: closed
- Created 5 years ago
- Reactions: 5
- Comments: 16 (5 by maintainers)
Commits related to this issue
- perf(orca): reuse ObjectMapper instances creating a new ObjectMapper instance for each Stage or other per-request contexts can be wasteful; ObjectMapper is safe to reuse across threads (after it is c... — committed to mattnworb/orca by mattnworb 5 years ago
- perf(artifacts): only load prior artifacts when needed When a pipeline is triggered via `POST /orchestrate`, OperationsController will resolve artifacts for the pipeline. The behavior of `ArtifactRes... — committed to mattnworb/orca by mattnworb 5 years ago
- perf(orca): reuse ObjectMapper instances (#2937) creating a new ObjectMapper instance for each Stage or other per-request contexts can be wasteful; ObjectMapper is safe to reuse across threads (aft... — committed to spinnaker/orca by mattnworb 5 years ago
- perf(orca): reuse ObjectMapper instances (#2937) creating a new ObjectMapper instance for each Stage or other per-request contexts can be wasteful; ObjectMapper is safe to reuse across threads (after... — committed to robzienert/orca by mattnworb 5 years ago
- perf(artifacts): use pageSize=1 when resolving prior artifacts This is a smaller-scoped attempt at https://github.com/spinnaker/orca/pull/2938, which relates to https://github.com/spinnaker/spinnaker... — committed to mattnworb/orca by mattnworb 5 years ago
- perf(artifacts): use pageSize=1 when resolving prior artifacts This is a smaller-scoped attempt at https://github.com/spinnaker/orca/pull/2938, which relates to https://github.com/spinnaker/spinnaker... — committed to mattnworb/orca by mattnworb 5 years ago
- perf(artifacts): use pageSize=1 when resolving prior artifacts (#2955) This is a smaller-scoped attempt at https://github.com/spinnaker/orca/pull/2938, which relates to https://github.com/spinnaker... — committed to spinnaker/orca by mattnworb 5 years ago
- perf(artifacts): use pageSize=1 when resolving prior artifacts (#2955) This is a smaller-scoped attempt at https://github.com/spinnaker/orca/pull/2938, which relates to https://github.com/spinnaker... — committed to spinnaker/orca by mattnworb 5 years ago
- perf(artifacts): use pageSize=1 when resolving prior artifacts (#2955) This is a smaller-scoped attempt at https://github.com/spinnaker/orca/pull/2938, which relates to https://github.com/spinnaker... — committed to spinnaker/orca by mattnworb 5 years ago
- feat(plugins): Add support for plugins creating a new ObjectMapper instance for each Stage or other per-request contexts can be wasteful; ObjectMapper is safe to reuse across threads (after it is con... — committed to armory-io/orca by mattnworb 5 years ago
- perf(artifacts): use pageSize=1 when resolving prior artifacts (#2955) This is a smaller-scoped attempt at https://github.com/spinnaker/orca/pull/2938, which relates to https://github.com/spinnaker/s... — committed to mattnworb/orca by mattnworb 5 years ago
- perf(artifacts): use pageSize=1 when resolving prior artifacts (#2955) This is a smaller-scoped attempt at https://github.com/spinnaker/orca/pull/2938, which relates to https://github.com/spinnaker/s... — committed to mattnworb/orca by mattnworb 5 years ago
- perf(artifacts): use pageSize=1 when resolving prior artifacts (#2955) (#2991) This is a smaller-scoped attempt at https://github.com/spinnaker/orca/pull/2938, which relates to https://github.com/s... — committed to spinnaker/orca by mattnworb 5 years ago
- perf(artifacts): use pageSize=1 when resolving prior artifacts (#2955) (#2990) This is a smaller-scoped attempt at https://github.com/spinnaker/orca/pull/2938, which relates to https://github.com/s... — committed to spinnaker/orca by mattnworb 5 years ago
I wanted to share an update on this issue - Spinnaker v1.12.13 contained my PR https://github.com/spinnaker/orca/pull/2991 above, and we recently deployed this to our production Spinnaker instance on July 9- here is a graph of Orca’s heap memory usage before and after:
thanks again for the help on this @ezimanyi @maggieneterval !
Hi, I think we figured out the problem we were having (we had mitigated the problem for 99% of our applications using Spinnaker, so finding a resolution was not the highest priority).
Some of the problem is caused by the unique way we are using Spinnaker, although I think there are a few improvements that could be made in Orca that would be good ideas in general.
A little bit about our environment: we use Spinnaker to deploy services to Kubernetes, and we trigger Spinnaker pipelines programmatically via another tool (we never trigger pipelines through the UI). We have a single pipeline that we snake all deployments and services through - since we are deploying k8s manifests via the Kubernetes V2 provider, we simply pass those from the first tool to the Spinnaker pipeline as artifacts in the trigger pipeline request. We don’t have a need for a unique pipeline per application/service.
When Gate calls the
POST /orchestrateendpoint of Orca, OperationsController’s parsePipelineTrigger method invokesartifactResolver.resolveArtifacts(pipeline).ArtifactResolver.resolveArtifacts(pipeline)loads every Execution of the pipeline in order to find the artifacts of the previous execution:Our problem is that, since we have a single pipeline instance for all services, before we enabled
oldPipelineCleanupwe had an unbounded list of old pipeline executions in our Redis instance (11000+). Each concurrent “trigger pipeline” request to Orca will (in our case) load this same (large)List<Execution>before throwing all but the last one away. Some of ourExecutioninstances are fairly large - 8mb in memory usage - because the “application” actually contains 100+ Kubernetes resources.Additionally, in our use case, we never actually need these priorArtifacts - because every pipeline trigger request includes the artifacts - but OperationsController/ArtifactResolver loads them anyway.
As mentioned above, we have two identical spinnaker instances that are both configured with the same set of Kubernetes clusters, which was useful for us to A/B test various ideas. Once we enabled
oldPipelineCleanup, the “main” instance was fully healthy, but the “test” instance still had the same OOM behavior. It took us a while to realize that this was because we had accidentally provisioned the Redis instance used in the second spinnaker instance in a different region than where the micro services were deployed, so each request to Redis had to traverse the Atlantic Ocean (from GCP’s us-central1 region to europe-west1), multiplied by the 1000+ past Execution instances stored in our Redis. Because of the latency, the growing List<Execution> is held in memory for far longer, allowing concurrent “Trigger pipeline” requests to fill up the entire heap as each thread tries to populate the same List<Execution>. Moving the Redis instance to be in the same region resolves the latency issue and therefore the OOM issue for this “test” spinnaker instance.So while a lot of this is probably due to our (unique?) use case, there are a few suggestions I have to improve the memory performance here. Please let me know if I should turn these into separate issues - I’d also be happy to make a stab at PRs for each.
ArtifactResolver.resolveArtifacts(Map)could be made to not bother to callExecutionRepository.retrievePipelinesForPipelineConfigId()until the point at which it actually needs to use any prior artifacts (when there areunresolvedExpectedArtifactsinresolveExpectedArtifacts(List, List, List, boolean)andexpectedArtifact.isUsePriorArtifact()istrue).Ideally it would not be necessary for
ArtifactResolver.getArtifactsForPipelineId(String, ExecutionCriteria)to load and fully hydrate every stored Execution instance of a Pipeline in order to access the most recent execution (although I can imagine that the schema of object storage in Redis makes that difficult - the SQL implementation is probably more straight forward). Adding a method inExecutionRepositorylikeretrieveLastExecutionForPipelineConfigId(String pipelineId)could be useful - perhaps the Redis implementation could look at all the executionIds of the pipeline and compare the startDate of each before hydrating the full object.Lastly, I noticed in our heap dumps that there are hundreds of thousands of
ObjectMapperinstances, since each instance ofcom.netflix.spinnaker.orca.pipeline.model.Stagecreates a new ObjectMapper instance (and our heap has tens of thousands of Stage instances when facing the OOM problems above).ObjectMapper is thread-safe after initial construction/configuration, and reusing the same instance would save some memory. Each ObjectMapper instance has a unique com.fasterxml.jackson.databind.ser.SerializerCache instance, meaning that all of these ObjectMappers are caching some of the data they have seen.
Thanks for the detailed solution and PRs, very helpful insight.
I submitted some PRs for 1 and 3 above 😎 : https://github.com/spinnaker/orca/pull/2937 and https://github.com/spinnaker/orca/pull/2938