quarkus: Prometheus micrometer metrics are slow on native binary
Describe the bug
Requests to the /q/metrics endpoint on a project with prometheus micrometer metrics, are much slower when build native compared to the jvm build.
Expected behavior
The calls should take around the same duration.
Actual behavior
When calling a native build, I get times around 420ms. When calling the same but in jvm mode, I got times around 10ms. I noticed also, that the cpu load is much higher for this calls:
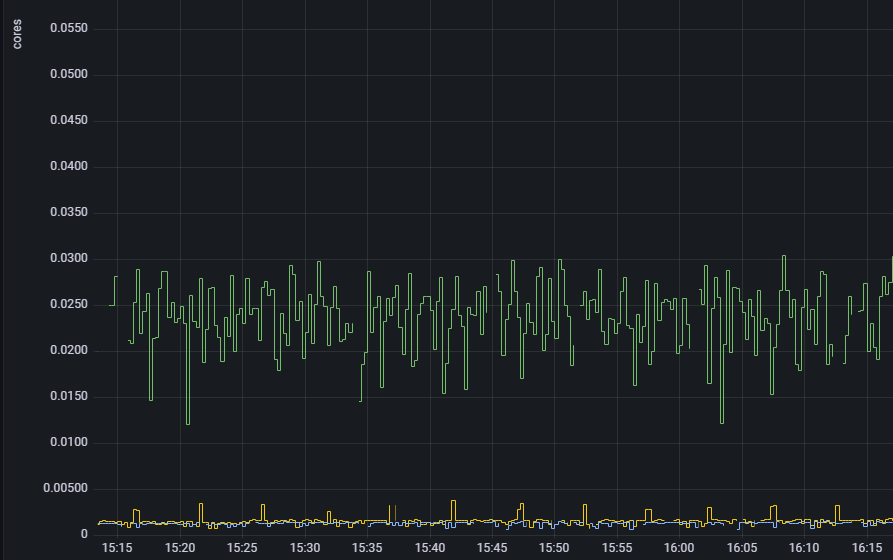 Green is the native container, yellow and blue are jvm containers. All containers are not doing much work except prometheus queries.
How to Reproduce?
Create a code starter project including:
- Micrometer Registry Prometheus
- Container Image Jib
Build a native and a jvm container and try to call /q/metrics
Output of uname -a or ver
No response
Output of java -version
11
GraalVM version (if different from Java)
21.2.0-java11
Quarkus version or git rev
2.2.3.Final
Build tool (ie. output of mvnw --version or gradlew --version)
gradlew 6.9
Additional information
No response
About this issue
- Original URL
- State: closed
- Created 3 years ago
- Comments: 25 (13 by maintainers)
figured out what was causing this issue. the container was underutilized in our k8s environment. it had 100m allocated in CPU processing, bumping it into 1000m alleviated the issue. many thanks for the help guys.
With quarkus 2.12 and graalvm 22.2 the issue with the performence of the system-metrics are resolved now, just checked it.
The problem must be somewhere in the system-binder. When setting the configuration:
Then the native calls are as fast as the jvm ones.
Before I figured that out, this was a blocker for us to use native-builds in production. The system-binder anyway doesn’t deliver to much information that can not be received over the container metrics directly, it is a option to disable this for now.