uptime-kuma: Highly inconsistent memory usage
⚠️ Please verify that this bug has NOT been raised before.
- I checked and didn’t find similar issue
🛡️ Security Policy
- I agree to have read this project Security Policy
Description

👟 Reproduction steps
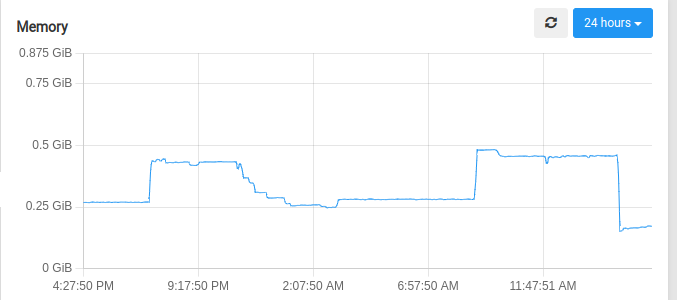
Start uptime kuma using docker compose, and observe. Memory usage spikes happen even though I’m doing nothing in my instance, it’s just reporting as usual.
👀 Expected behavior
No such inconsistent memory usage spikes
😓 Actual Behavior
Memory usage spikes.
🐻 Uptime-Kuma Version
1.21.2
💻 Operating System and Arch
Ubuntu 22.04
🌐 Browser
Irrelevant
🐋 Docker Version
No response
🟩 NodeJS Version
n/a
📝 Relevant log output
No relevant logs
About this issue
- Original URL
- State: closed
- Created a year ago
- Comments: 16 (2 by maintainers)
Just writing down some progress in case people want to continue work on this.
During a few days of testing, I have not found any obvious memory leak. Instead, the increase in memory usage is due to many compounding factors.
clear-old-datajob in worker threads requires additional temporary memory allocation. Failure to allocate may have deadlocked the thread and prevent it from starting.Allocations on the server
The normal operations of the server requires very little memory, ~60MB on the heap during my profiling. But there are a few exceptions:
responseData.toString()inaxios. For every http request which returns text data,axioswould convert the response from an array to String at the end of processing. This process would allocate a new chunk of memory to store the new String. If you are making a request to a big file every minute, usage would quickly add up. Running a modifiedaxioswith this line removed would basically eliminate 90% of heap allocations of the server. But this would break the “keyword” monitor since we do require a string search there.1wmode. We fetch all the data for the whole week, 1 request increase the memory usage by ~16MB. Running this also seem to increase the kernel memory usage as it buffers more of the sqlite database into memory.V8 not cleaning up
The above 2 cases should not be an issue since V8 is suppose to garbage collect after the variables go out of scope. Unfortunately, V8 is a memory hog and will not return the memory to the OS. Profiling shows the responseData Strings are under
GC Root, which means they should be garbage collected, but doesn’t do so during a few minutes of profiling. GC like this will also lead to memory fragmentation, and compaction is expensive so V8 rarely runs it. This explains the big steps in reduction of memory usage, which I suspect is when compaction finally kicks in. This can be controlled by setting the cli argumentmax_old_space_size=(value in MB). But this value will depend of the environment deployed and setting it should be up to the user.clear-old-datajob and Worker threadsThe job currently runs on worker threads, which seems to start a new V8 instance with independent memory management. On startup, it needs to load all the database libraries again, and all the js files need to be loaded as a string in the
code spaceof the heap. By experiment this needs 32-48MB of memory to start. This is probably the main cause of getting OOM killed. Also, not all of it is returned to the OS after job finished, but I don’t know if there is an actual leak here since the default Chrome DevTools profiler doesn’t seem to show this. Regardless rewriting this job to not use worker threads would probably eliminate this.Research and explanation was already written above. If you care about the memory used, update to
1.22and set a memory limit for the container. (cli argument--memory=) It should run fine with around ~256MB.I’ve had some crashes again and I’ve noticed that for my instances on Fly.io, the out of memory crashes are related to the nightly “clear-old-data” task. In a success scenario, the logs look like this:
When it fails, it already stops after the first line:
Also note that there’s a 1.5 minute delay between starting the job and it being out of memory, while in the success scenario, the whole job runs in a few seconds. Maybe there’s a bug with a memory leak in that job’s code?
This seems to prevent the
max_old_space_sizeCLI arg to work as expected. I experimented with different values for my instance on Fly.io, but it still gets OOM killed every 2-3 days. I assume, as you expect, that not all the memory is returned to the OS after theclear-old-datajob and so even if the main thread stays under themax_old_space_size, total memory consumption still rises like before. At least the graphs don’t seem to have changed much.At the very least, it should then be possible to use
max_old_space_sizeto force garbage collection before it gets OOM killed.