harvester: [BUG] Monitoring pod OOM after run a period of time
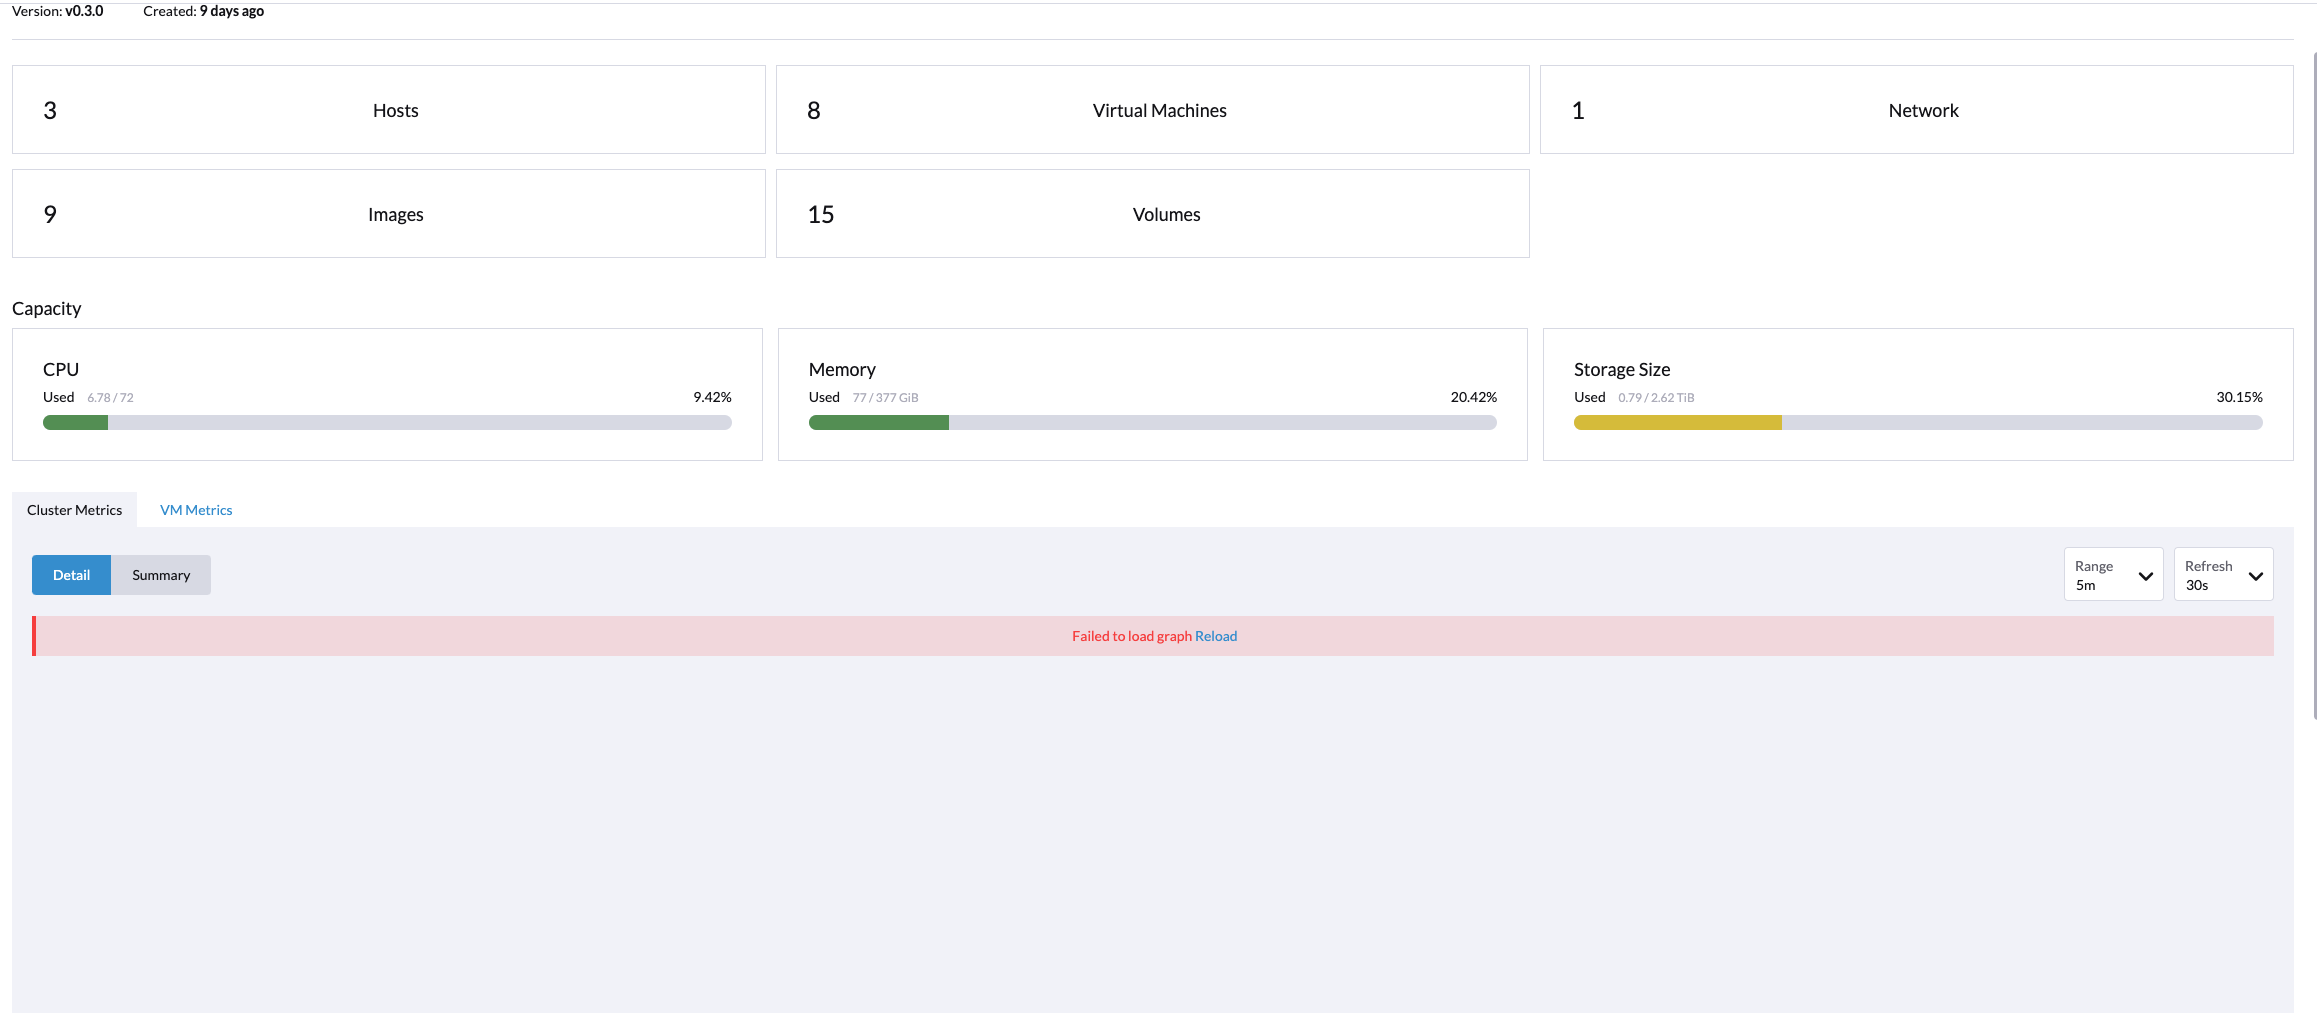
Describe the bug After running the Prometheus pod for a period of time e.g 9 days, the monitoring dashboard is empty due to the Prometheus pod being killed by OOM.
To Reproduce
ks get pod
NAME                                                     READY   STATUS             RESTARTS   AGE
prometheus-rancher-monitoring-prometheus-0               2/3     CrashLoopBackOff   8          19m
Expected behavior
Support bundle
Environment:
- Harvester ISO version: v0.3.0
- Underlying Infrastructure (e.g. Baremetal with Dell PowerEdge R630):
Additional context Add any other context about the problem here.
About this issue
- Original URL
- State: closed
- Created 3 years ago
- Comments: 34 (20 by maintainers)
Validate Test Scenario 2 with Harvester master-9664bf67-head. Following test cases can pass.
Case1: prometheus-node-exporter pods don’t crash
rancher-monitoring-prometheus-node-exporterDaemonSet don’t crash.Case2: Update prometheus-node-exporter in rancher-monitoring ManagedChart
prometheus-node-exporter.resources.limits.memoryfrom180Mito200Mi.resources.limits.memoryinrancher-monitoring-prometheus-node-exporterDaemonSet is200Mi.According to the investigation https://github.com/harvester/harvester/issues/1531#issuecomment-1098545912. The Prometheus monitoring pod is running without crash and the monitoring-node-exporter did not encounter restarts as well.
When abnormal, front end is stucking in “Loading…”, but there are no ongoing/failure http requests. To narrow down the scope, we will close this issue and continue tracking in #2150
@w13915984028, @guangbochen Double confirm this issue on harvester
v1.0.1, still encounter the monitoring chart empty sympton. Please check and advice whether we should look deep into this issue.During the 4 hours period checking, the monitoring chart still encounter empty several times like the following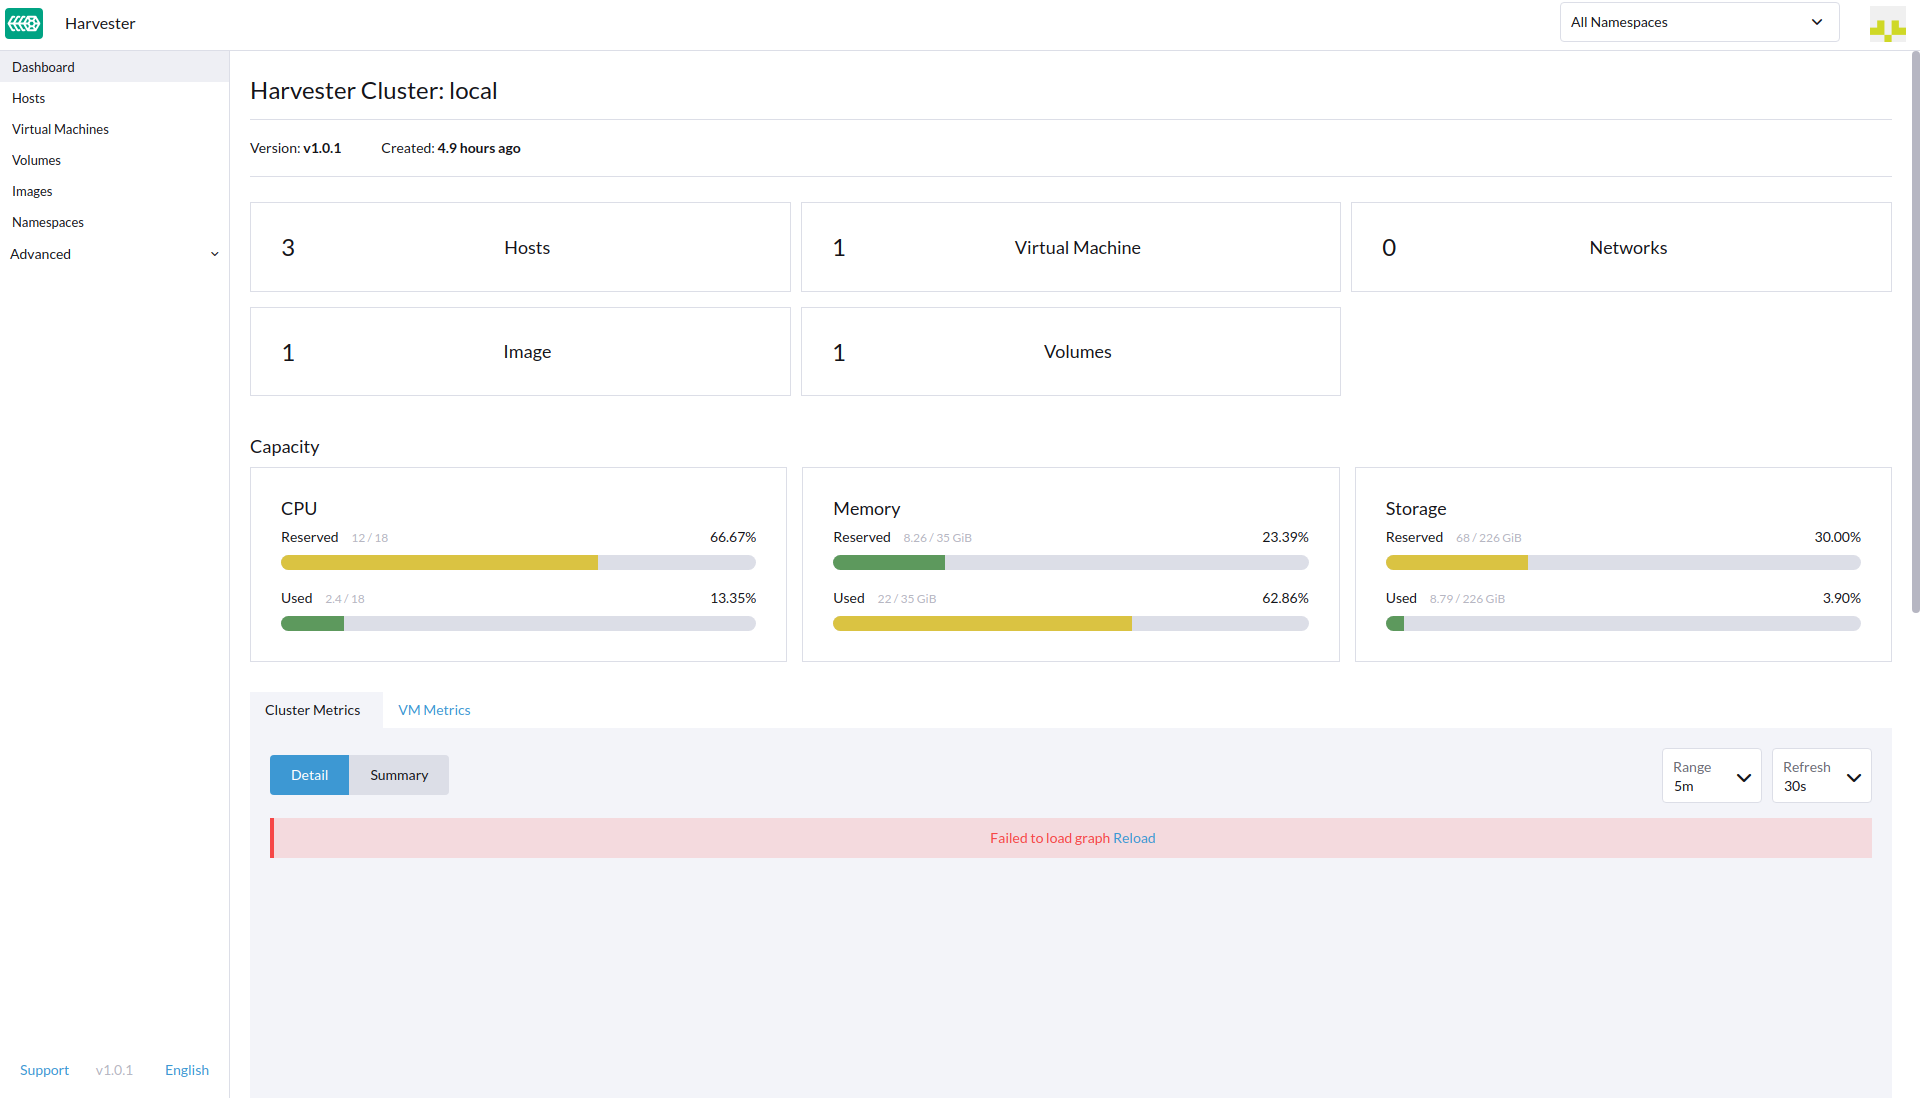
The Prometheus pod running as expected, the node-exporter pod did not restart
Support Bundle
supportbundle_8c4a93cf-b167-4ef8-b4d4-acb17de158fe_2022-04-13T13-15-14Z.zip
I think there will be two approaches to update the related chart configs, can we please help to verify them accordingly and choose the most feasible one:
ManagedChartCR to the ETCD, this is initially configured via https://github.com/harvester/harvester-installer/blob/master/pkg/config/templates/rancherd-13-monitoring.yaml#L1 as a bootstrap resource.fleet-local/rancher-monitoring.