sentry-javascript: Memory leaks after updating from 7.37.1 to 7.37.2
Is there an existing issue for this?
- I have checked for existing issues https://github.com/getsentry/sentry-javascript/issues
- I have reviewed the documentation https://docs.sentry.io/
- I am using the latest SDK release https://github.com/getsentry/sentry-javascript/releases
How do you use Sentry?
Sentry Saas (sentry.io)
Which SDK are you using? If you use the CDN bundles, please specify the exact bundle (e.g. bundle.tracing.min.js) in your SDK setup.
SDK Version
7.37.2
Framework Version
NextJS 13.1.5
Link to Sentry event
No response
SDK Setup
Sentry.init({
  dsn: DSN,
  environment: ENVIRONMENT,
  release: RELEASE,
  tracesSampler: (samplingContext) => !!samplingContext.parentSampled || TRACES_SAMPLE_RATE,
  integrations: [
    // new Sentry.Replay({sessionSampleRate: 0, errorSampleRate: 1, maskAllInputs: true, useCompression: false}), // tried this
    // new Sentry.Replay({sessionSampleRate: 0, errorSampleRate: 1, maskAllInputs: true}), // then tried this
    // then tried without Replay
    new Sentry.BrowserTracing({tracingOrigins: ["redacted"]}),
    new Integrations.CaptureConsole({levels: ["error"]}),
    new Integrations.ExtraErrorData({depth: 10}),
  ],
});
Steps to Reproduce
- Update sentry packages from 7.37.1 to 7.37.2 and disabled replay compression
- Observe unexpected changes server memory utilization and server crashes
- Re-enable replay compression
- Observe memory changes still present after re-enabling replay compression (i.e. establish that compression enabled/disabled is not the cause)
- Remove replay’s completely
- Observe memory changes still present without replays (i.e. establish that replays are not the cause)
Expected Result
No changes to memory utilization, no server crashes
Actual Result
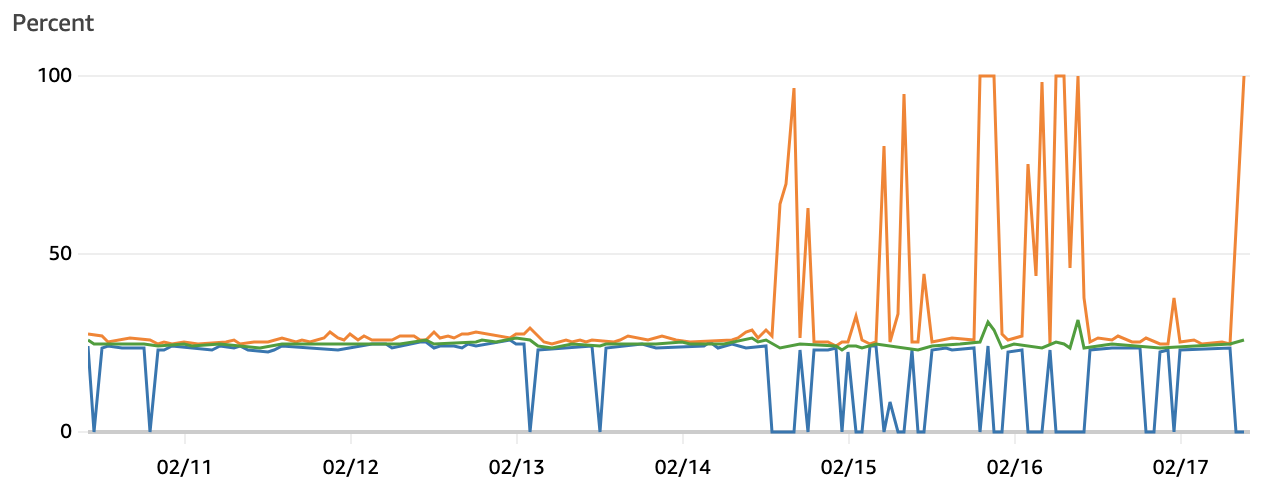
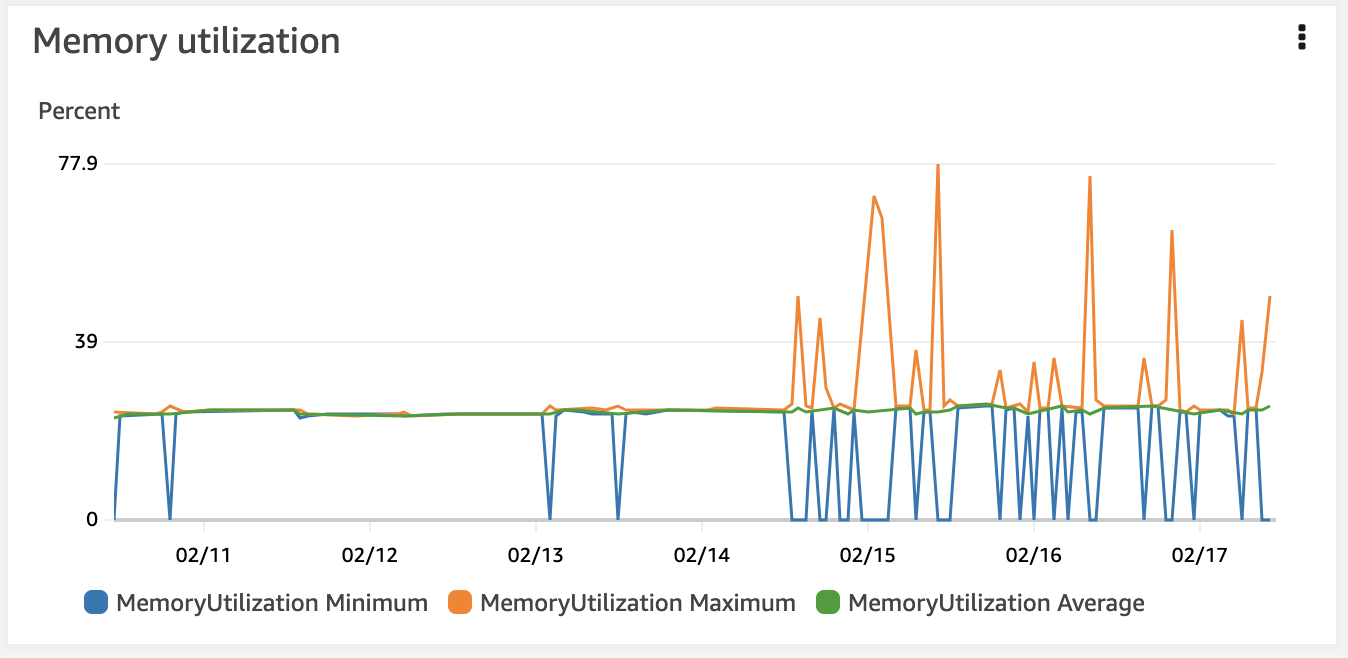
After updating the packages, memory utilisation changed very dramatically with huge variations. On several occasions this brought down the instances (503s reported by users). Consistent across several clients, e.g.

About this issue
- Original URL
- State: closed
- Created a year ago
- Comments: 21 (13 by maintainers)
flushis simply waiting for outbound requests to Sentry to be completed. I’d be surprised if this is the culprit. Hosting provider shouldn’t matter either.Due to the spiky nature of the graph I would put my bet on some large unexpected computation. Usually, the only heavy computation we do is to normalize/serialize events before sending them to sentry. It could very well be that
reqcontains a very large object in this case.We’re investigating this.