sentry-javascript: Memory Leak with `includeLocalVariables` v7.46.0
How do you use Sentry?
Sentry Saas (sentry.io)
Which SDK are you using? If you use the CDN bundles, please specify the exact bundle (e.g. bundle.tracing.min.js) in your SDK setup.
SDK Version
7.46.0
SDK Setup
Sentry.init({
  dsn: __YOU_DSN__,
  includeLocalVariables: true,
});
Steps to Reproduce
- Start Sentry with
includeLocalVariablesset totrue.
Expected Result
- Server does not run out of memory.
Actual Result
- Server runs out of memory.
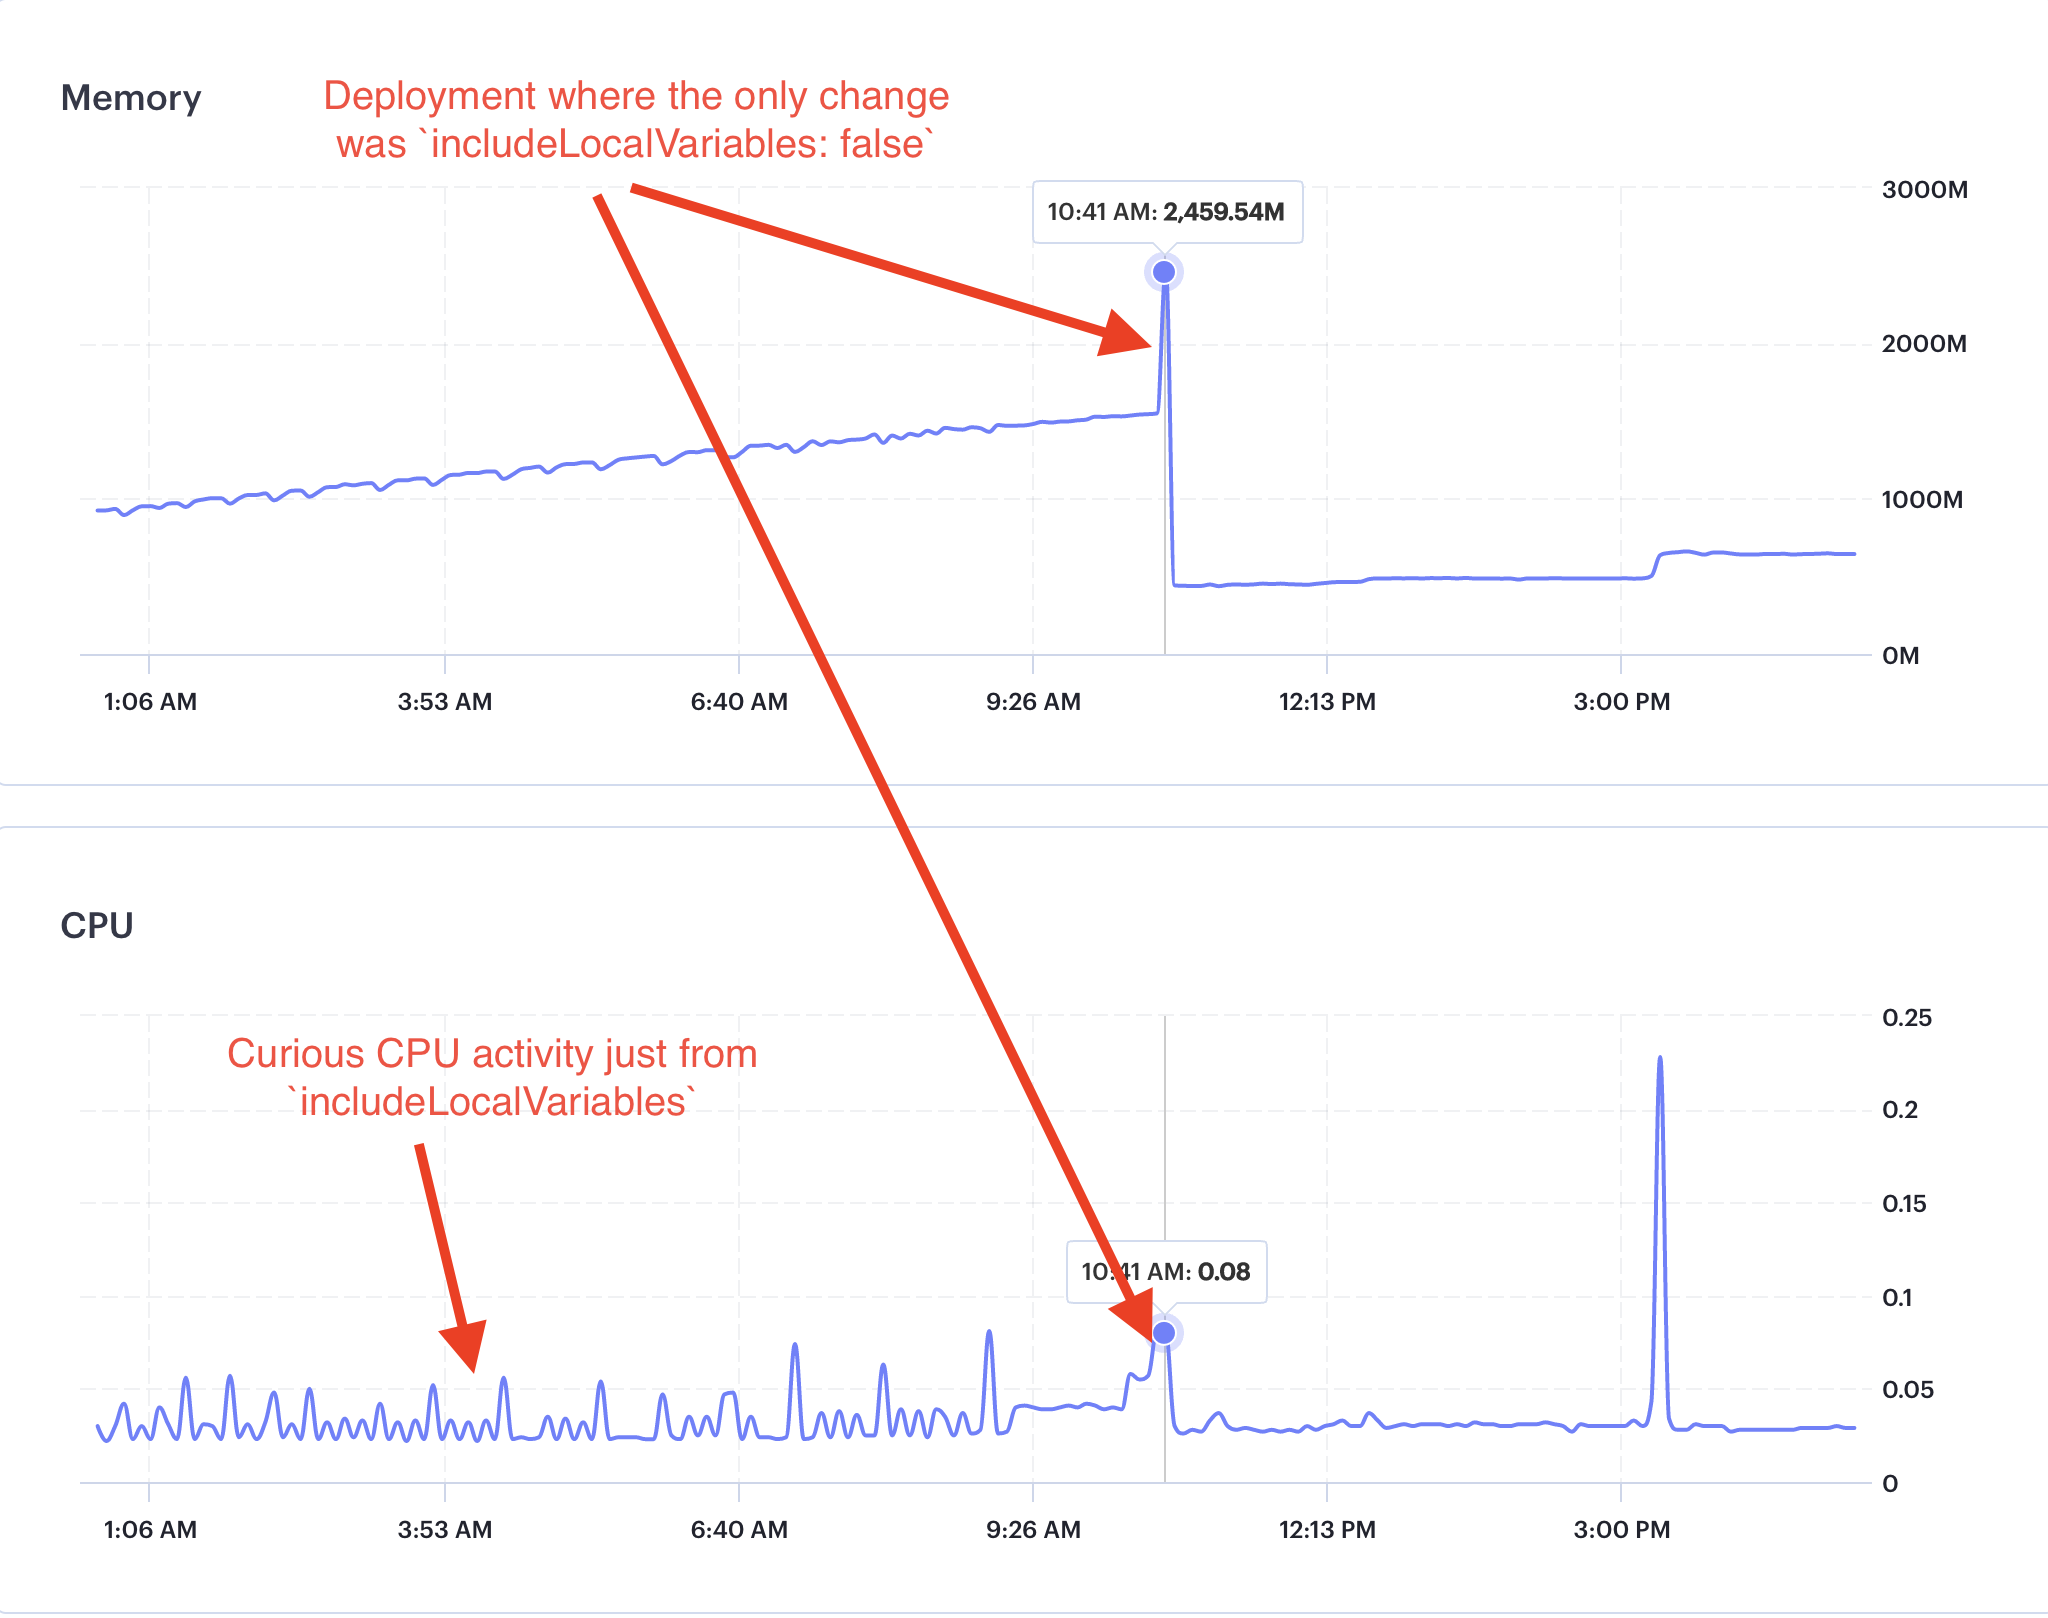
The memory leak in the LocalVariables integration first documented in #7230 persists after the most recent update that aimed to fix the memory leak.
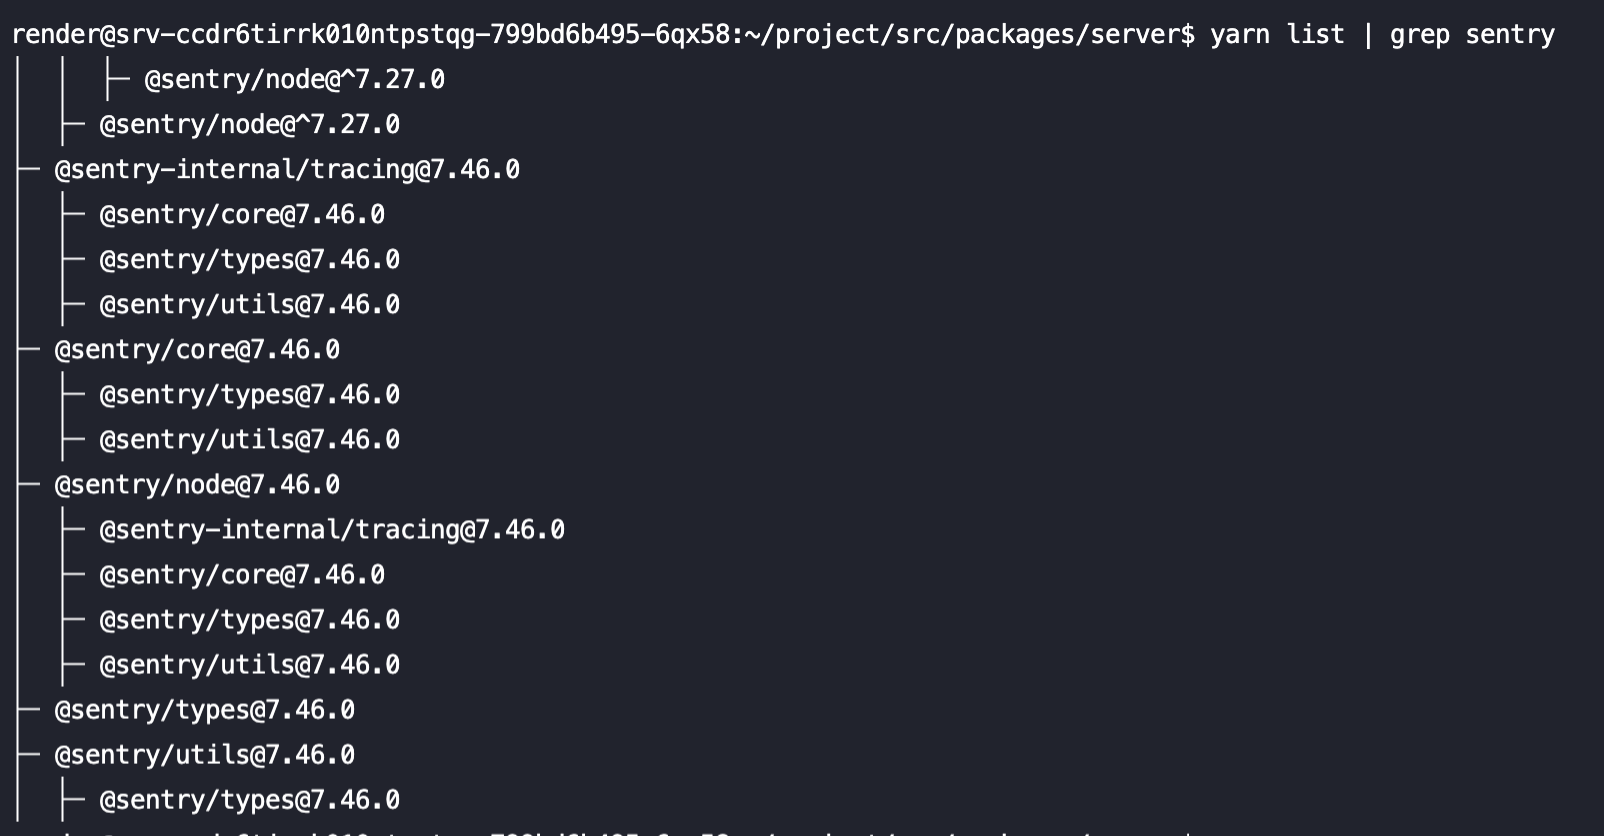
Proof that we are using Sentry v7.46.0: This is the shell output from immediately after taking the screenshot above:
Notably, there was also an uptick in CPU utilization after re-enabling includLocalVairables with v7.46.0 (at the marker below). This surprises me because no Sentry events were sent during that entire period, yet it was constantly using CPU and memory resources. I thought the integration works by using Chrome’s DevTools Protocol to capture the local variables when errors are thrown, not constantly. Perhaps this impact is the impact of merely listening for any thrown errors.
About this issue
- Original URL
- State: closed
- Created a year ago
- Reactions: 1
- Comments: 18 (3 by maintainers)
@timfish @AbhiPrasad Hey, guys! I upgraded our backend to Node.js v19, and the memory leak and curious CPU consumption from Node.js v16 are both gone! This is with both
includeLocalVariables: trueandLocalVariables({ captureAllExceptions: true }). Thank you!For reference, I did actually open an issue with Node.
@timfish Unfortunately, we cannot upgrade to Node v18 because our cloud provider is Render, whose Node image uses an older version of GLIBC that requires Node v16, and one of our dependencies uses GLIBC. Hence, upgrading to Node v18 would require us to change our cloud provider or create a custom Docker image, neither of which is worth the hassle.
We’ve now updated the docs + integration to make this only work on Node 18+, since it seems
AsyncLocalStoragealso seems to have memory leak issues with the inspector.This means we can’t solve this for Node 16 - since the issue is actually with the Node standard libraries having bugs 😦 @DannyNemer
I’ve managed to reproduce a leak with the following:
@sentry/nodev7.46.0And then load testing via
autocannon http://localhost:3001/asyncThe memory grows by roughly 1GB every time the load testing is run and doesn’t appear to be released.
The leaking can be fixed (ie. memory usage stays well below 200MB) if I do any ONE of the following
includeLocalVariables: falseapp.use(Sentry.Handlers.requestHandler())/syncinstead of/asyncI captured a heap snapshot after briefly smashing the
/asyncroute, and it looks like the domains/promises are getting leaked:My first guess would be that there’s some kind of Node.js bug where domains are leaked when using the inspector API.
@timfish Node v16.20.0
@timfish Could we test what happens when we create multiple promises (add event loop backpressure)?
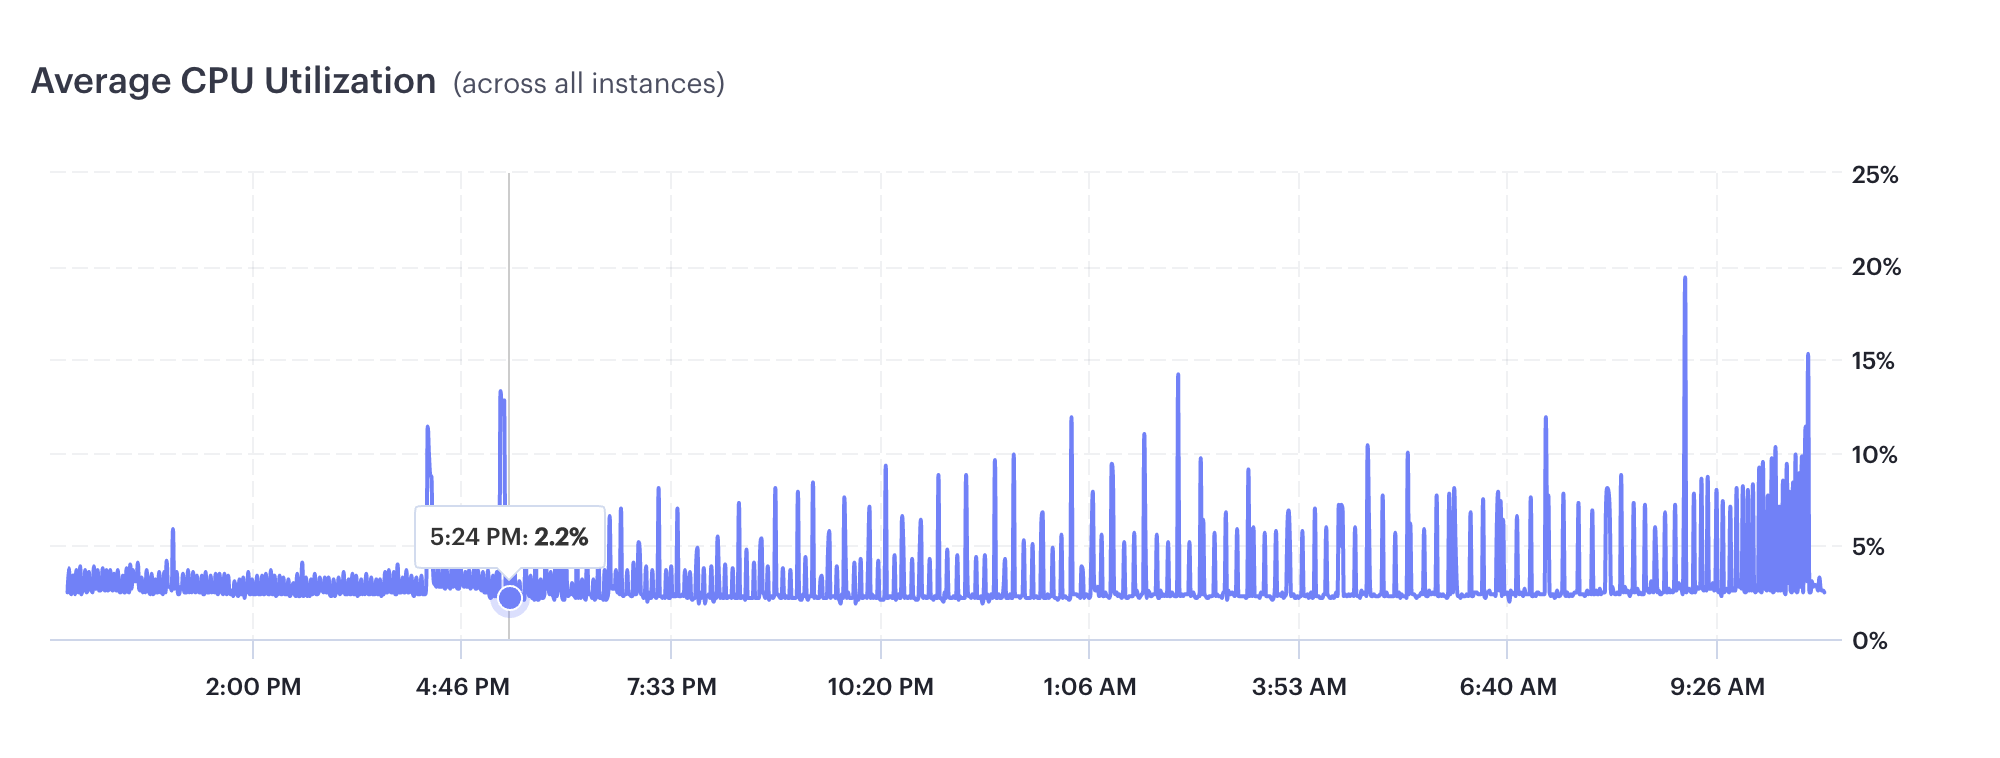
@timfish There was only one “real” request during that entire graph (the spike at around 3:00 PM). There is about one ping and health check for other services every few seconds. Also, we use zero
consoleAPIs. So there was barely any activity at all on the server.