aspnetcore: Cannot debug Blazor Wasm application on .Net 6: Unable to attach to browser
Is there an existing issue for this?
- I have searched the existing issues
Describe the bug
When launching a Blazor wasm application in debug, the browser (either Chrome or Edge) tab will open and the application will crash with “got exception System.Net.WebSockets.WebSocketException (0x80004005): The server returned status code ‘500’ when status code ‘101’ was expected.”
By setting "launchBrowser": false, I can open a Chrome tab to the application but the debugging still doesn’t work.
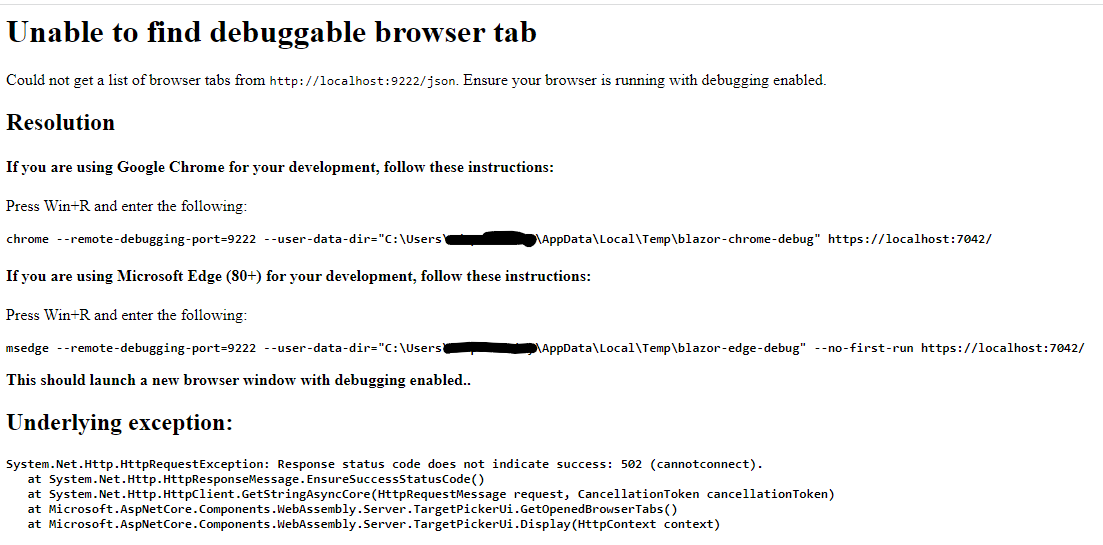
If I use Shift-Alt-D, I get a page that says Unable to find debuggable browser tab. Could not get a list of browser tabs from http://localhost:9222/json. Ensure your browser is running with debugging enabled..
I can however navigate to http://localhost:9222/json and see the document.
This is very similar to https://github.com/dotnet/aspnetcore/issues/26824 but the fix does not work for me.
I have uninstalled every other .Net sdk version and have tried with my proxy disabled.
This happens with every Blazor Wasm app I can launch including the default project template.
This issue does not happen with Firefox but it shows a message that debugging is explicitly not supported
Expected Behavior
The application should open in the browser all allow breakpoints to be set in the code.
Steps To Reproduce
- Install .Net 6
- Create a new project with
dotnet new blazorwasm - Open the project in Visual Studio 2022
- Launch the application either with IIS or Kestrel targetting Chrome or Edge
Exceptions (if any)
got exception System.Net.WebSockets.WebSocketException (0x80004005): The server returned status code ‘500’ when status code ‘101’ was expected. at System.Net.WebSockets.WebSocketHandle.ConnectAsync(Uri uri, CancellationToken cancellationToken, ClientWebSocketOptions options) at System.Net.WebSockets.ClientWebSocket.ConnectAsyncCore(Uri uri, CancellationToken cancellationToken) at Microsoft.WebAssembly.Diagnostics.DevToolsProxy.Run(Uri browserUri, WebSocket ideSocket) at Microsoft.WebAssembly.Diagnostics.DebugExtensions.<>c__DisplayClass2_0.<<UseDebugProxy>g__ConnectProxy|5>d.MoveNext()
.NET Version
6.0.202
Anything else?
I’m using Visual Studio Professional 2022 v17.1.6 Using Chrome Version 101.0.4951.41 (Official Build) (64-bit) Using Edge Version 100.0.1185.50 (Official build) (64-bit)
dotnet --info output:
F:\temp>dotnet --info .NET SDK (reflecting any global.json): Version: 6.0.202 Commit: f8a55617d2
Runtime Environment: OS Name: Windows OS Version: 10.0.19042 OS Platform: Windows RID: win10-x64 Base Path: C:\Program Files\dotnet\sdk\6.0.202\
Host (useful for support): Version: 6.0.4 Commit: be98e88c76
.NET SDKs installed: 6.0.202 [C:\Program Files\dotnet\sdk]
.NET runtimes installed: Microsoft.AspNetCore.App 6.0.4 [C:\Program Files\dotnet\shared\Microsoft.AspNetCore.App] Microsoft.NETCore.App 6.0.0-rc.2.21480.5 [C:\Program Files\dotnet\shared\Microsoft.NETCore.App] Microsoft.NETCore.App 6.0.4 [C:\Program Files\dotnet\shared\Microsoft.NETCore.App] Microsoft.WindowsDesktop.App 6.0.4 [C:\Program Files\dotnet\shared\Microsoft.WindowsDesktop.App]

What Chrome shows before crashing:

The debug tab:
Log in visualstudio-js-debugger.txt:
{"tag":"runtime.launch","timestamp":1651256875766,"message":"Launch returned error","metadata":{"error":{"message":"Unable to attach to browser","stack":"Error: Unable to attach to browser\n at h.target [as prepareLaunch] (c:\\program files\\microsoft visual studio\\2022\\professional\\common7\\ide\\commonextensions\\microsoft\\jsdiagnostics\\debugger\\debugAdapter\\out\\src\\targets\\browser\\browserLauncher.js:124:19)\n at h.result (c:\\program files\\microsoft visual studio\\2022\\professional\\common7\\ide\\commonextensions\\microsoft\\jsdiagnostics\\debugger\\debugAdapter\\out\\src\\targets\\browser\\browserLauncher.js:168:15)\n at t.Binder.captureLaunch (c:\\program files\\microsoft visual studio\\2022\\professional\\common7\\ide\\commonextensions\\microsoft\\jsdiagnostics\\debugger\\debugAdapter\\out\\src\\binder.js:248:13)\n at t.Binder._launch (c:\\program files\\microsoft visual studio\\2022\\professional\\common7\\ide\\commonextensions\\microsoft\\jsdiagnostics\\debugger\\debugAdapter\\out\\src\\binder.js:224:9)\n at async Promise.all (index 5)\n at t.Binder.result [as _boot] (c:\\program files\\microsoft visual studio\\2022\\professional\\common7\\ide\\commonextensions\\microsoft\\jsdiagnostics\\debugger\\debugAdapter\\out\\src\\binder.js:172:9)\n at t.default._onMessage (c:\\program files\\microsoft visual studio\\2022\\professional\\common7\\ide\\commonextensions\\microsoft\\jsdiagnostics\\debugger\\debugAdapter\\out\\src\\dap\\connection.js:145:27)"},"wasCancelled":false,"name":"h"},"level":2}
About this issue
- Original URL
- State: open
- Created 2 years ago
- Comments: 32 (20 by maintainers)
It is. It happens sometimes and persists until you rebuild the project and remove a browser profile in the browser setting
Thank you for the very fast response.
Here is the full content of http://localhost:9222/json:
Here is the full debugger file
visualstudio-js-debugger.txt