bokeh: In python3, rectangle does not appear when x axis is type datetime
I’ve been having trouble plotting rectangular glyphs with bokeh in Python 3. I can’t find this issue documented anywhere, or any efforts to correct it.
I’m trying to plot rectangles whose x-axis extent is given as a timedelta, and whose positions are datetimes.
This is a minimum example that produces the error. I generate a set of times via numpy’s datetime64, convert them to datetime objects, and plot the set of rectangles. ~No rectangles appear in the plot if the times are close to the current UTC, but if I shift them back 50 years they appear just fine.~ This was in error – The rectangles appear, but their sizes vary. If I make them narrower by a factor of 10, they disappear altogether.
#!/bin/env python
from datetime import datetime, timedelta
import numpy as np
from bokeh.plotting import figure, show
from bokeh.models import DatetimeTickFormatter

## The line below is the key -- If I subtract 50 years from the current date, the rectangles appear just fine.
## If i don't subtract them, the rectangles are not rendered.
t0 = datetime.utcnow() - timedelta(weeks=52 * 50)

times = t0.timestamp() * 1e3 + np.linspace(0, 5, 100, endpoint=False) * 3600 * 1e3
times = times.astype('datetime64[ms]')

plot = figure(
      output_backend='svg',
      plot_height=500,
      plot_width=1280,
      x_axis_label='UTC Time',
      y_axis_label="",
      y_axis_type='linear'
)

plot.xaxis.formatter = DatetimeTickFormatter(
      hours=['%H:%M'],
      minutes=['%H:%M'],
      seconds=['%H:%M']
)

dm = np.linspace(0, 100, 20)
width = (np.diff(times)[0] * 0.8).astype(timedelta)
times, dm = np.meshgrid(times, dm)
plot.rect(
      x=times.astype(datetime).flatten(),
      y=dm.flatten(), width=width,
      height=100 / 20, name='rect'
)

show(plot)
Note the indicated line right after the import statements – it seems that bokeh is having trouble with recent dates in Python3, probably because their unix times in milliseconds are very large. If I shift back to 1970, as shown here, the error goes away.
I suspect that this function may be part of the problem. The internal serialization in bokeh converts all datetimes to milliseconds since the unix epoch, which might be overflowing something.
About this issue
- Original URL
- State: closed
- Created 4 years ago
- Reactions: 1
- Comments: 16 (11 by maintainers)
I should have mentioned that… sorry. Having rerun it, I realized I had this example confused with a different one. In that code, the rectangles disappeared unless I increased the width. I’ll update the original post in a second.
With the code as written above, I get the following: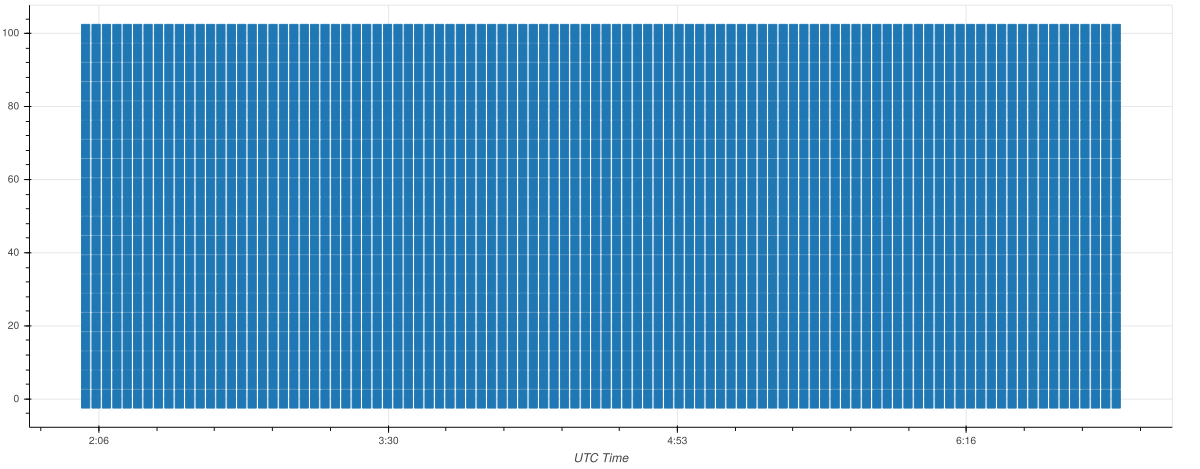
Commenting out the time shift, I get:
If your company depends on bokeh that much, you may want to consider donating towards development of this project, so that we could hire developers to help with expanding our test suite and reduce the number of, especially such severe, regressions in future.