webpack: [5.1.2] No longer the very useful colored tabular stats in webpack 5
Bug report
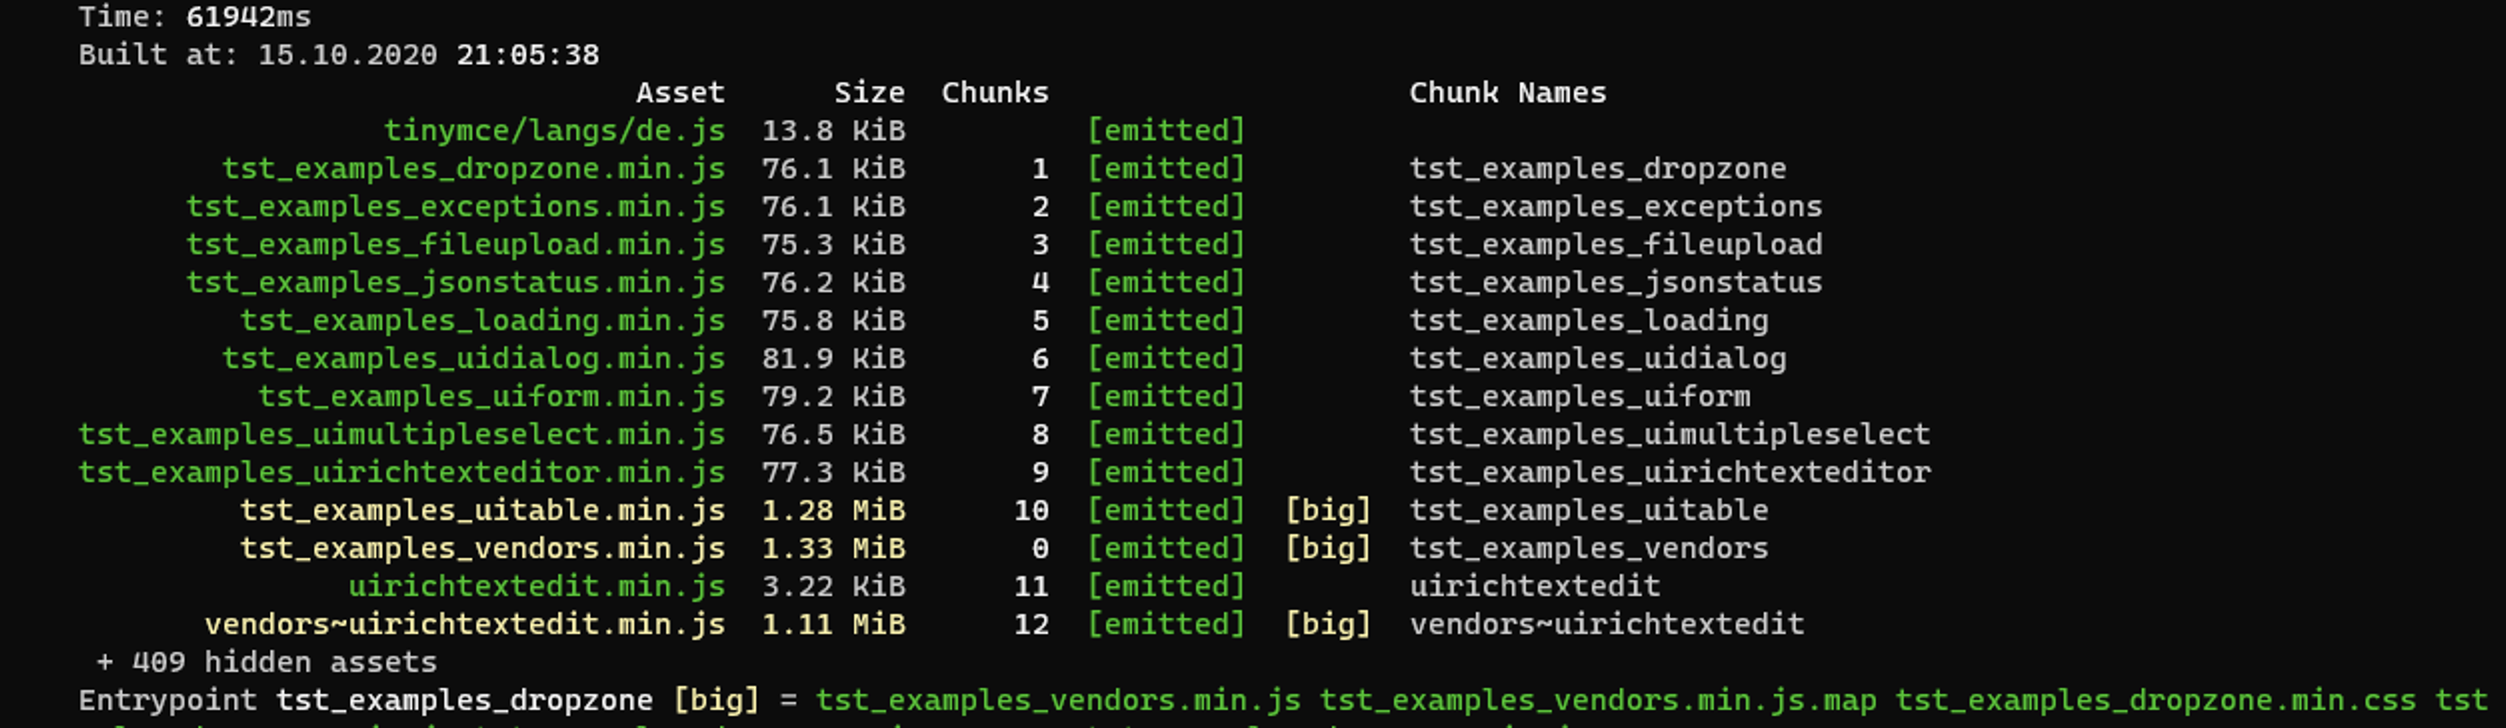
In webpack 4 the stats looked like this
and in webpack 5 it looks like this:

I’m using the following unchanged stat configuration and was wondering how to get back the very helpful tabular output in version 4. I also noticed, that the output no longer seems to be colored.
{
	all: undefined,
	assets: true,
	assetsSort: 'field',
	cached: false,
	children: false,
	chunks: false,
	chunkModules: false,
	chunkOrigins: false,
	chunksSort: 'field',
	colors: true,
	errors: true,
	errorDetails: true,
	excludeAssets: assetName => !/\.js$/i.test(assetName),
	hash: false,
	modules: false,
	modulesSort: 'field',
	publicPath: false,
	reasons: false,
	source: false,
	timings: true,
	version: true,
	warnings: true
}
What is the current behavior?
If the current behavior is a bug, please provide the steps to reproduce.
What is the expected behavior?
Other relevant information: webpack version: 5.1.2 Node.js version: 14.13.0 Operating System: 10.15.7 Additional tools:
About this issue
- Original URL
- State: closed
- Created 4 years ago
- Reactions: 9
- Comments: 37 (14 by maintainers)
Sorry for commenting on a closed issue, but I just spent an entire afternoon trying to get the tabular assets to show up in Webpack 5 stats output just to find this discussion today. Was anyone able to get that table back into Webpack 5? Is there any plugins for that?
IMO, the tabular assets from webpack 4 was waaaay clearer to visualize the structure of the output, specially when using the devserver and files are not written to disk but you need to see where they are located.
I have a use case where I only use Webpack for bundling JS and CSS without generating any HTML automatically, so I need to know exactly where the resulting files are located so I can generate the proper
linkandscriptmanually. That table was extremely helpful for that.Thank you for that.
Sadly it only changed a word in my output: “asset” to “hidden”
Sad to see the nice table overview of the sizes of the assets gone. Was useful to quickly skim over the sizes row to see if something was wrong.
Now it’s quick to miss if something got unexpectedly big: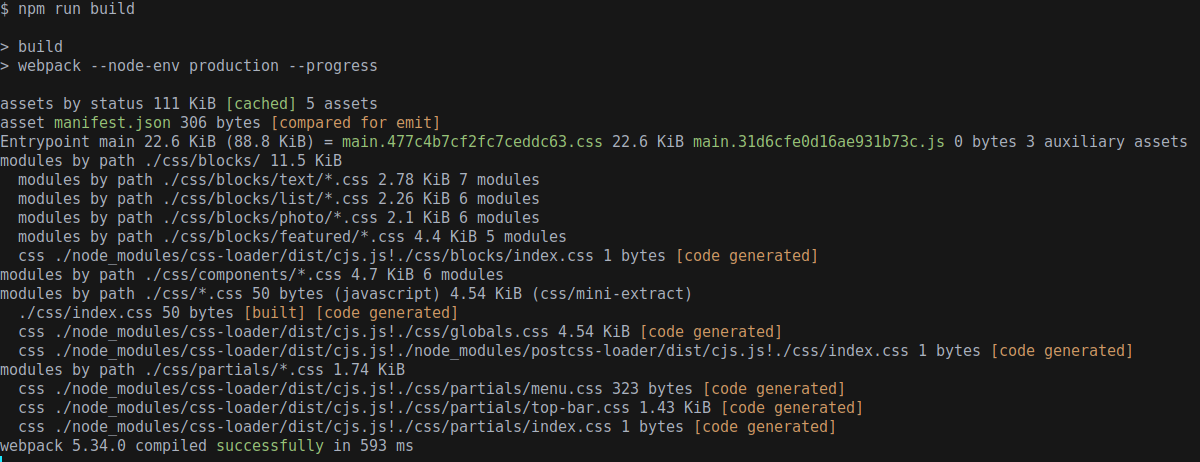
@doberkofler it was described in changelog, we change it to reduce memory usage and do it better, feel free to use options to setup them as you want
I also encountered the same problem, I wrote a plugin to format the output of webpack5, maybe you can refer to it.
https://github.com/LeMeridien/webpack-stats-prettify-plugin
@doberkofler did you find a way to get something resembling the the old tabular/table view?
I updated some of my stuff today to webpack 5, and was quite confused on what happened to the stats output.
Even more so when I tried to tweak it to become a little more clearer and nothing seemed to help.
I understand that this minor issue and (clearly) I already tried (quite a bit) to change the options but (and I might be wrong) nothing shows the results in the nicely (each asset with it’s size in a line and colored if big) combined tabular way it was shown in webpack 4. If I missed something, please be so kind and point me into the right direction to get “something” like the tabular output in webpack 4.
@oles I personally preferred the webpack 4 output and currently use the following settings in webpack 5
@evilebottnawi Excellent. This is now working. Thank you and keep up the good work.
This is what I found very helpful in a projects with a large number of assets:
A table of the generated assets
A table of the entry points and the dependencies