vue-storefront: Sever Memory Leak Issues on Production
Current behavior
1. Images — only requests to image resources
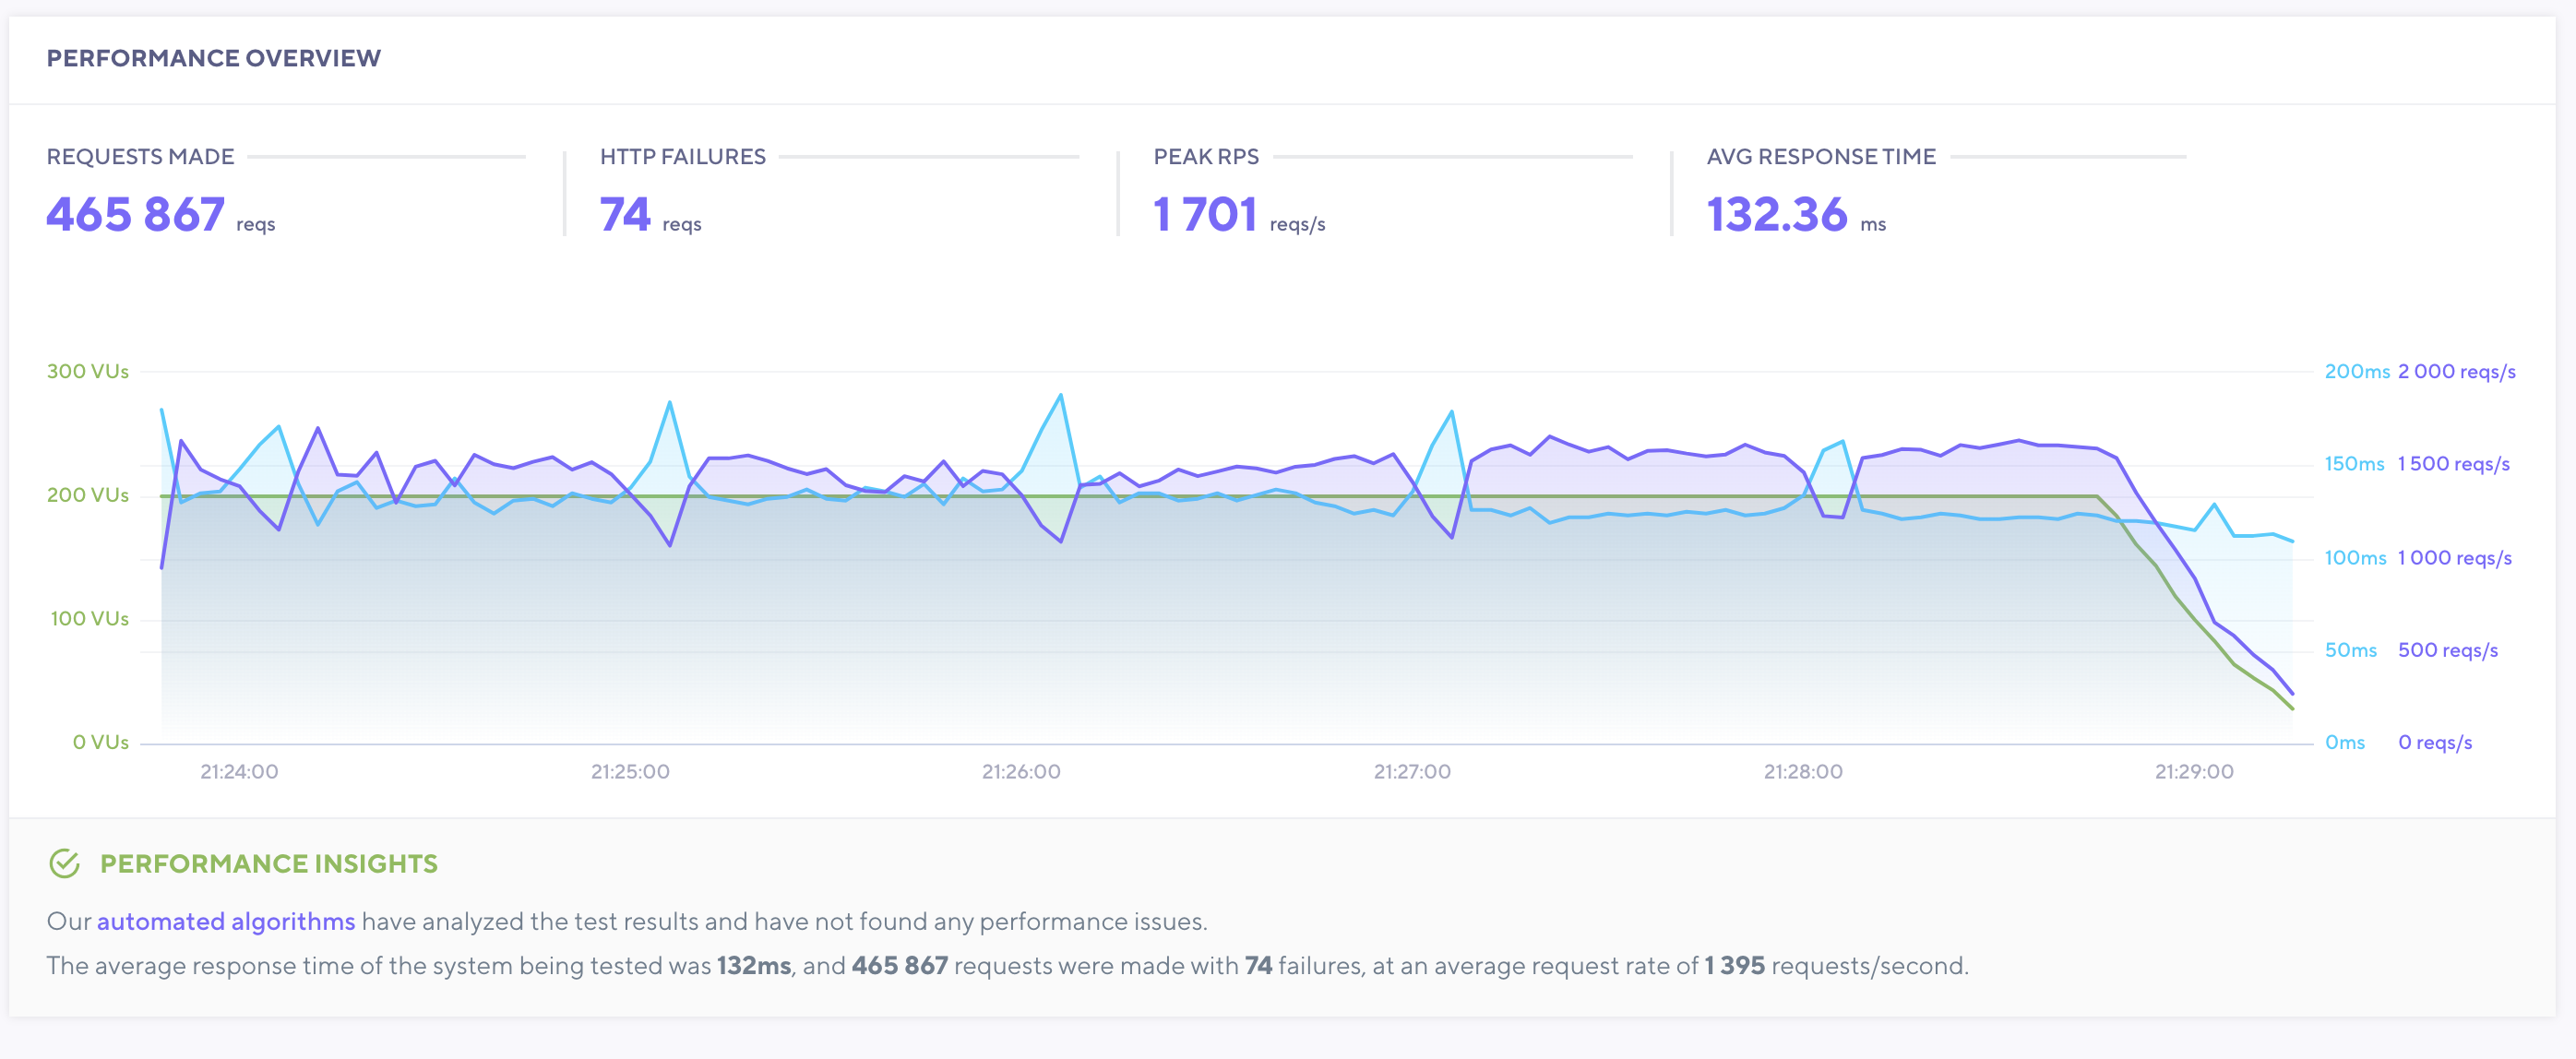
Very high cpu and memory usage when requesting images to the server, it manages to serve 239 req/s and response time skyrockets to 2000ms.

2. PWA — only requests to urls
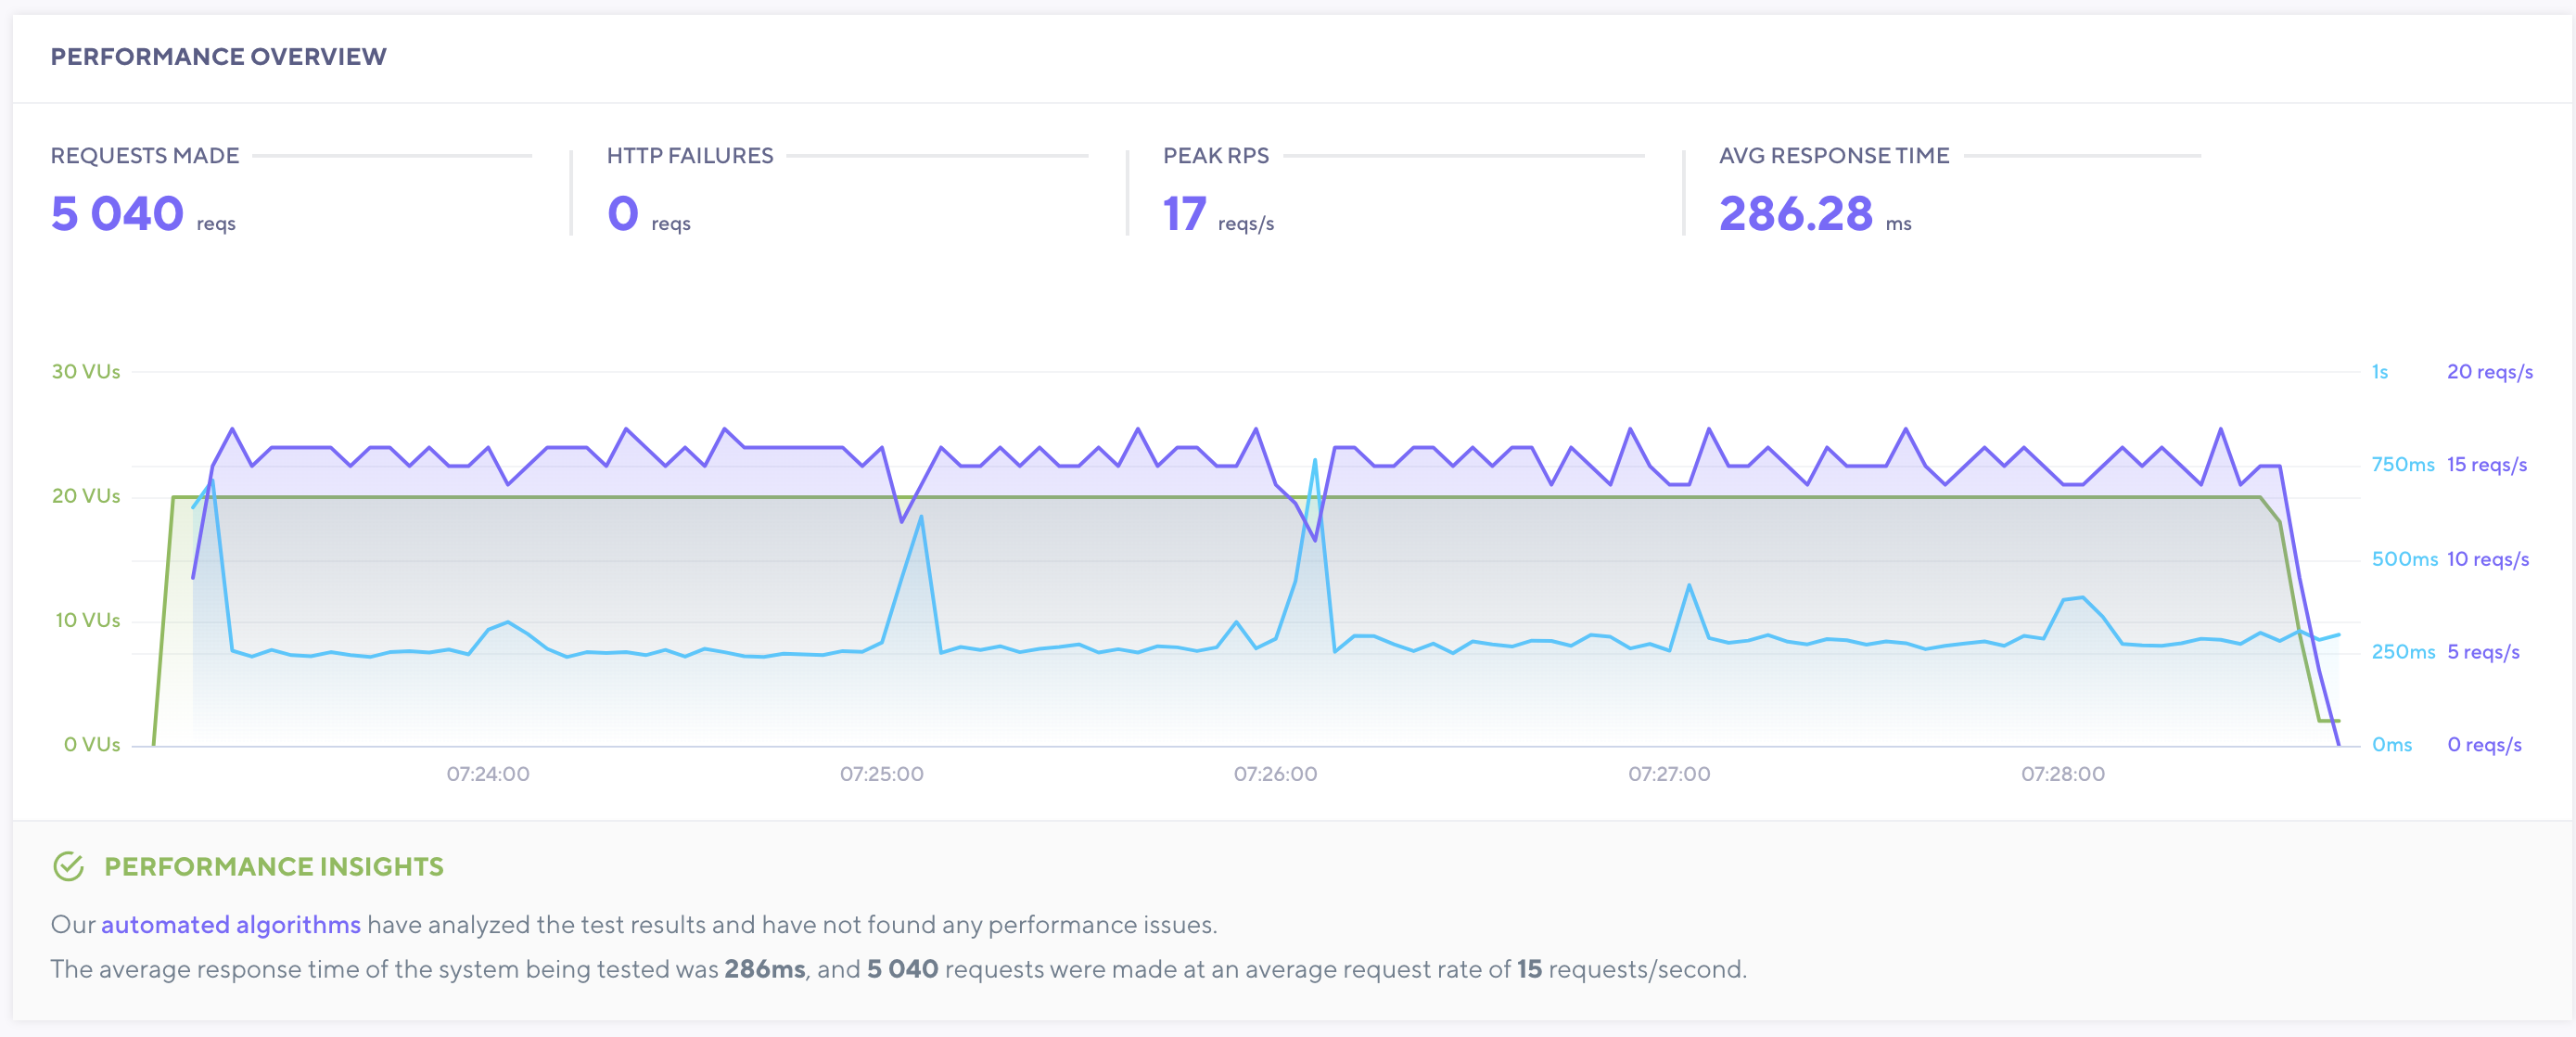
This test only made requests to urls like /es or /modelo-mahou-bears.html?color=azul. Basically homepage, category views and product views very high cpu and memory usage and server struggles to serve a very low number of requests. Response time of curl to homepage url is about 2.3s after clearing cache and about 0.7s with cache hit.
First test was made with 20 Virtual users, and the server just managed to cope with the traffic. Server managed to serve 17req/s with an average res. time of 286.28ms

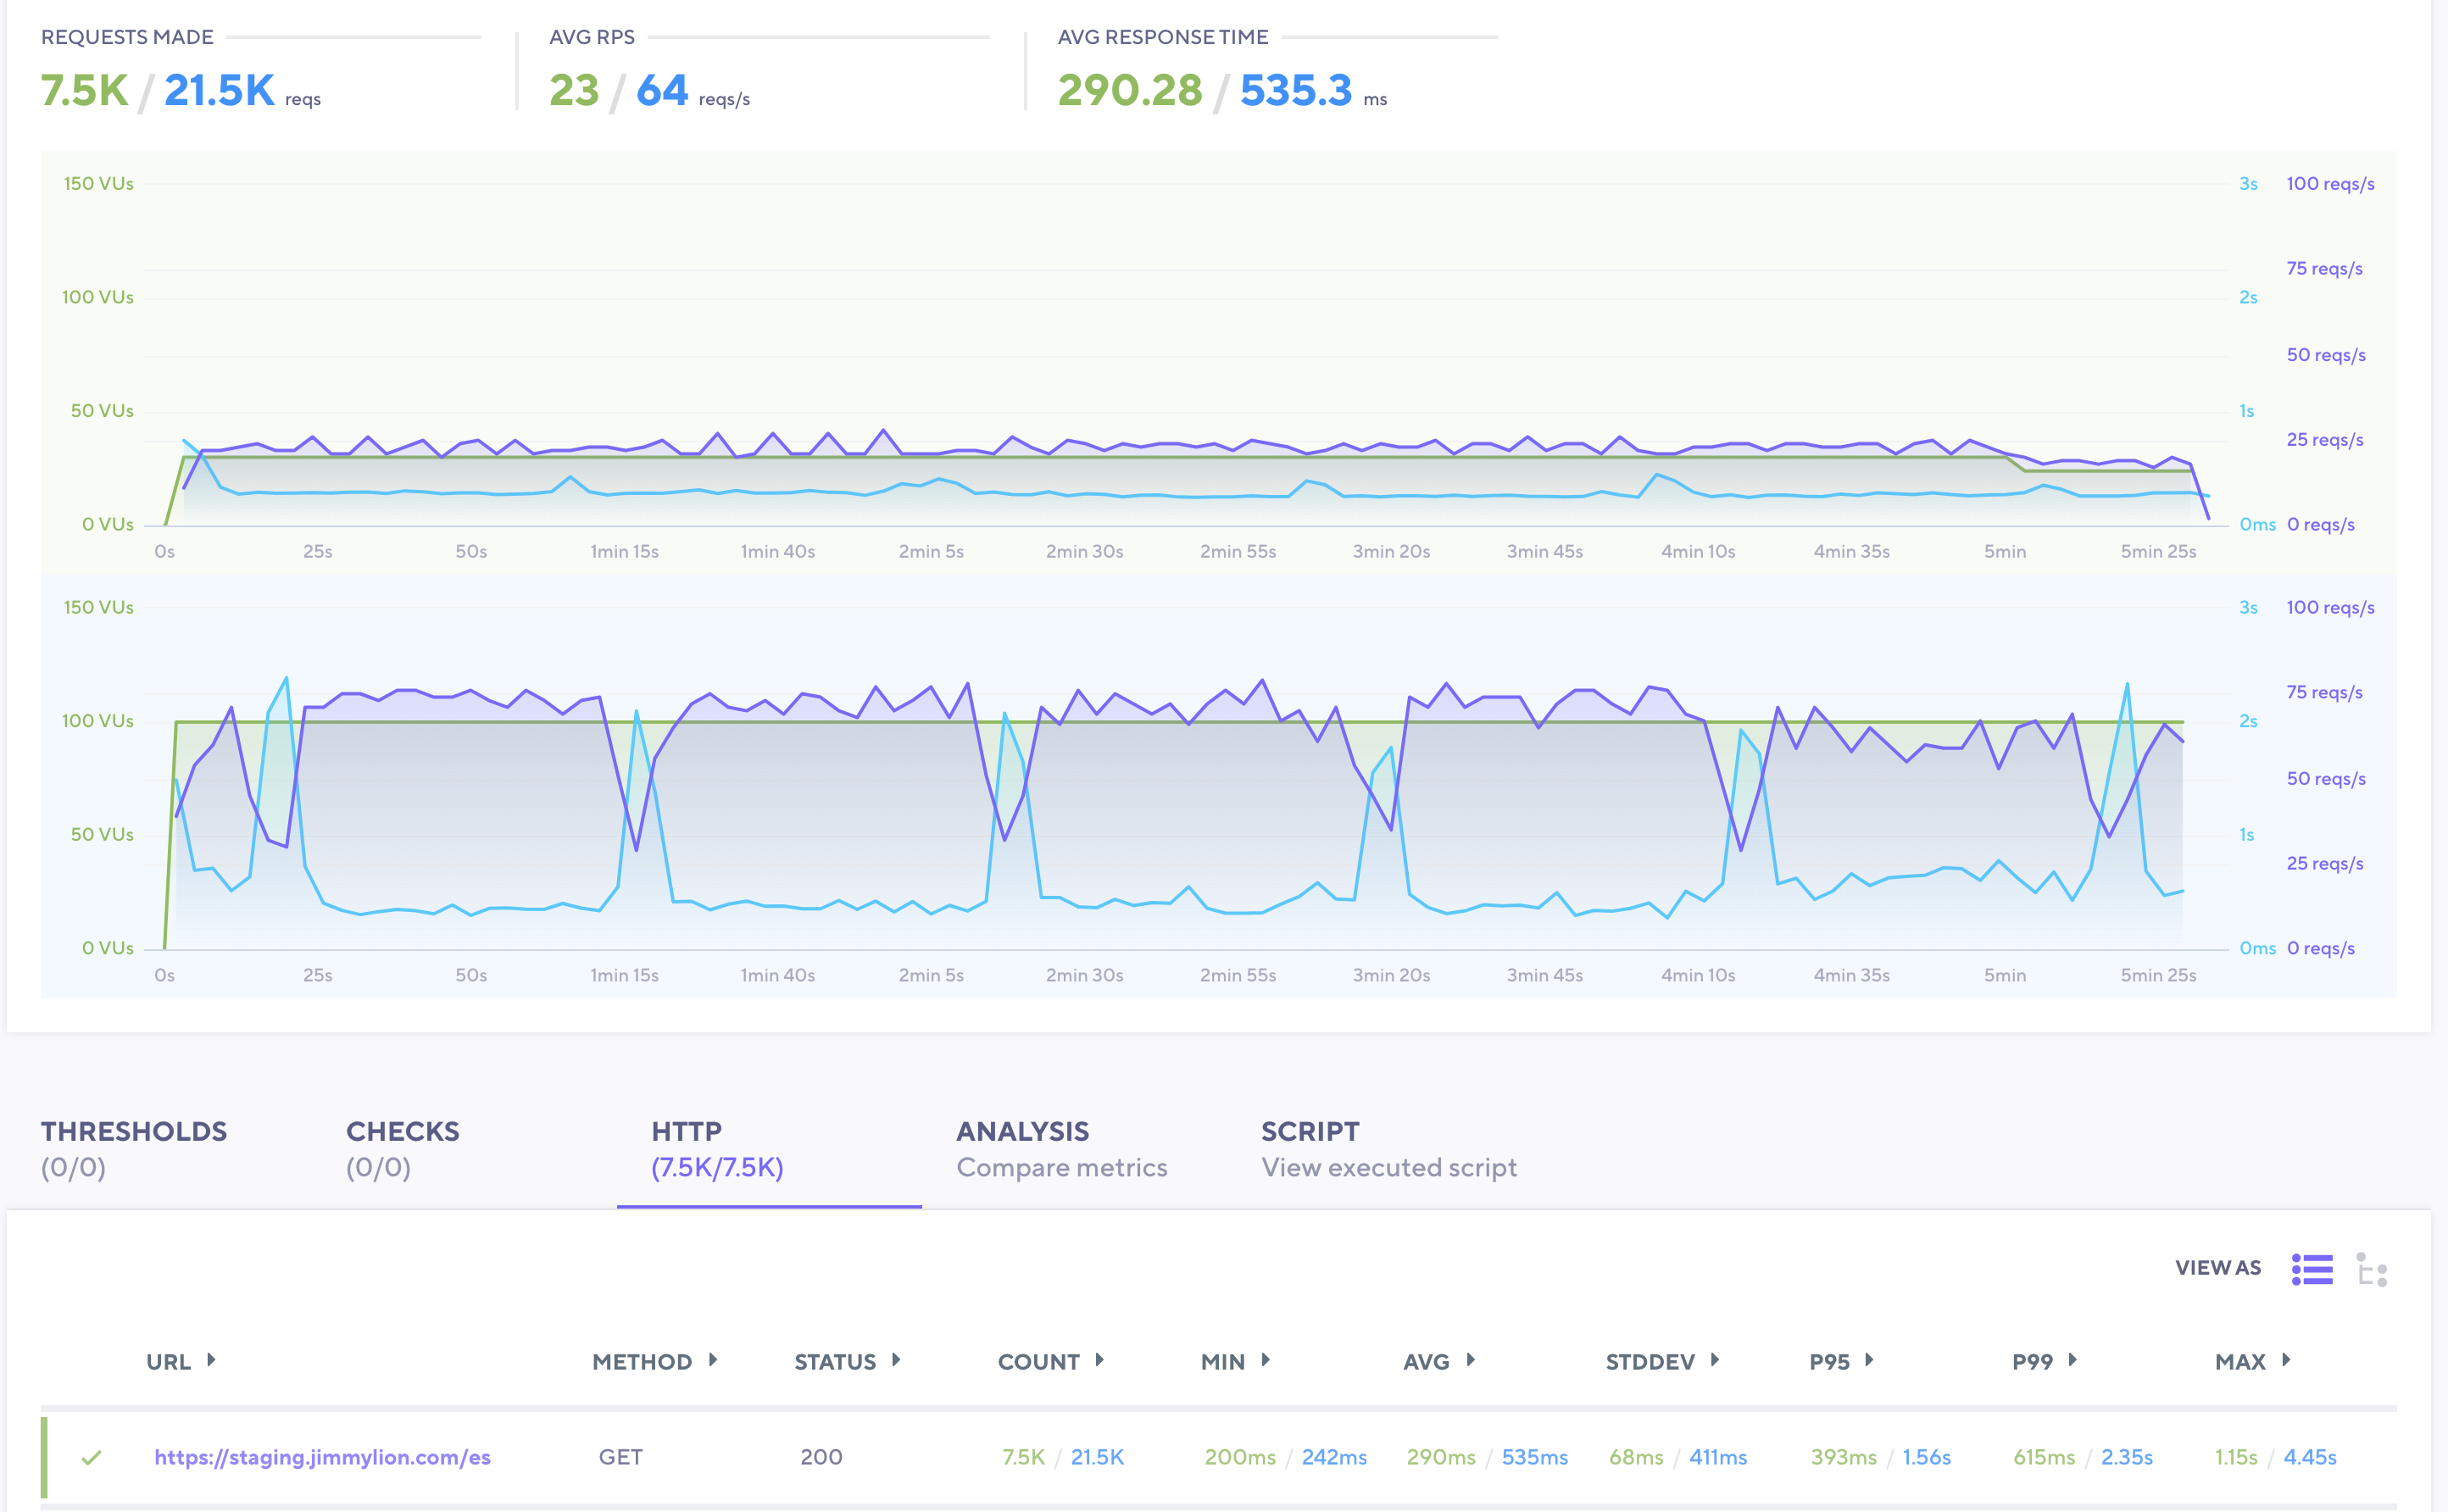
Second test was made with 50 virtual users and server was struggling and finally run out of resources.

Also, memory is leaking as node processes increase in memory usage with each request (to 1-1.5GB quickly). This was initially causing our servers to run out of memory and restart
We have mitigated this by configuration in our process manager (Phusion Passenger), by setting up the min and max node processes and also using the passenger_max_requests which shuts down processes when they reach X number of requests, which we have configured to 2000 requests/process.
This has prevented servers running out of memory and now usage is stable as processes are continuously recycled. However, we know this is a workaround and we should find the source of the memory leak/s.
This is 2 tests compared — 1 with 30 Virtual Users and another with 100 Virtual Users

Expected behavior
We’d expect the PWA to perform as described here https://medium.com/the-vue-storefront-journal/vue-storefront-performance-tests-and-architecture-ready-for-traffic-peaks-279c4c783412
Steps to reproduce the issue
We used http://k6.io/ for stress tests.
Repository
Can you handle fixing this bug by yourself?
- YES
- NO
Which Release Cycle state this refers to? Info for developer.
Pick one option.
- This is a bug report for test version on https://test.storefrontcloud.io - In this case Developer should create branch from
developbranch and create Pull Request2. Feature / Improvementback todevelop. - This is a bug report for current Release Candidate version on https://next.storefrontcloud.io - In this case Developer should create branch from
releasebranch and create Pull Request3. Stabilisation fixback torelease. - This is a bug report for current Stable version on https://demo.storefrontcloud.io and should be placed in next stable version hotfix - In this case Developer should create branch from
hotfixormasterbranch and create Pull Request4. Hotfixback tohotfix.
Environment details
- Browser: Irrelevant
- OS: Ubuntu
- Node: 10.x
- Code Version: 1.10
Staging server
Staging server where the tests above have been performed has 8 CPUs / 16GB RAM and it is used for M2 + VSF PWA + VSF API + ElasticSearch.
Production server
Similar tests have been done in production with only slightly better results.
W1/W2: 8 cpus + 12GB RAM — each in charge of pwa + vsf api + magento api

About this issue
- Original URL
- State: closed
- Created 4 years ago
- Comments: 15
@pkarw found the cause, it was the
dynamicConfigReloadsetting. By setting it to false, memory leak disappearsThis setting is causing memory leaking both in 1.10.0 and 1.10.6 with default theme