VictoriaMetrics: VMAgent sharding and streaming aggregation causes duplicate series data and does not summarize correctly
Describe the bug
When doing sharding of vmagent with streaming aggregation enabled, there is no differentiation between vmagent shards.
For example, say there is a metric requests_total which should be aggregated to requests_total:30s_without_instance_total. Each shard will output requests_total:30s_without_instance_total with no labels to differentiate the series.
An example of what this ends up doing with 4 shards is this.
Two graphs, one using aggregation, the other using the original data. Both delivered by vmagent shards.
sum(rate(input_events:30s_without_instance_pod_total[1m])) vs sum(rate(input_events[1m]))
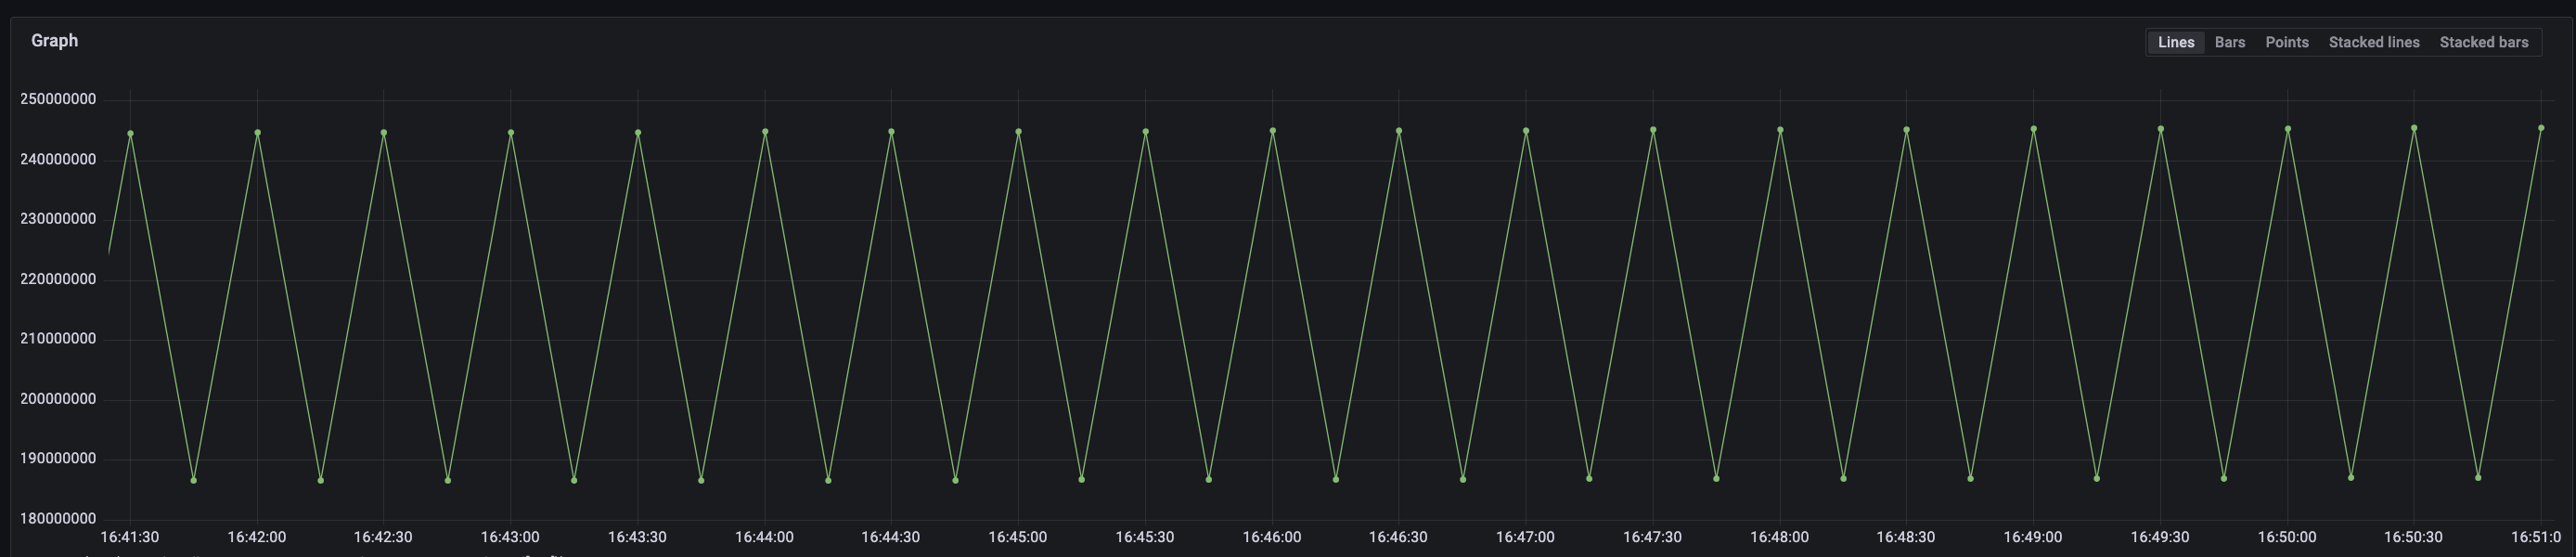
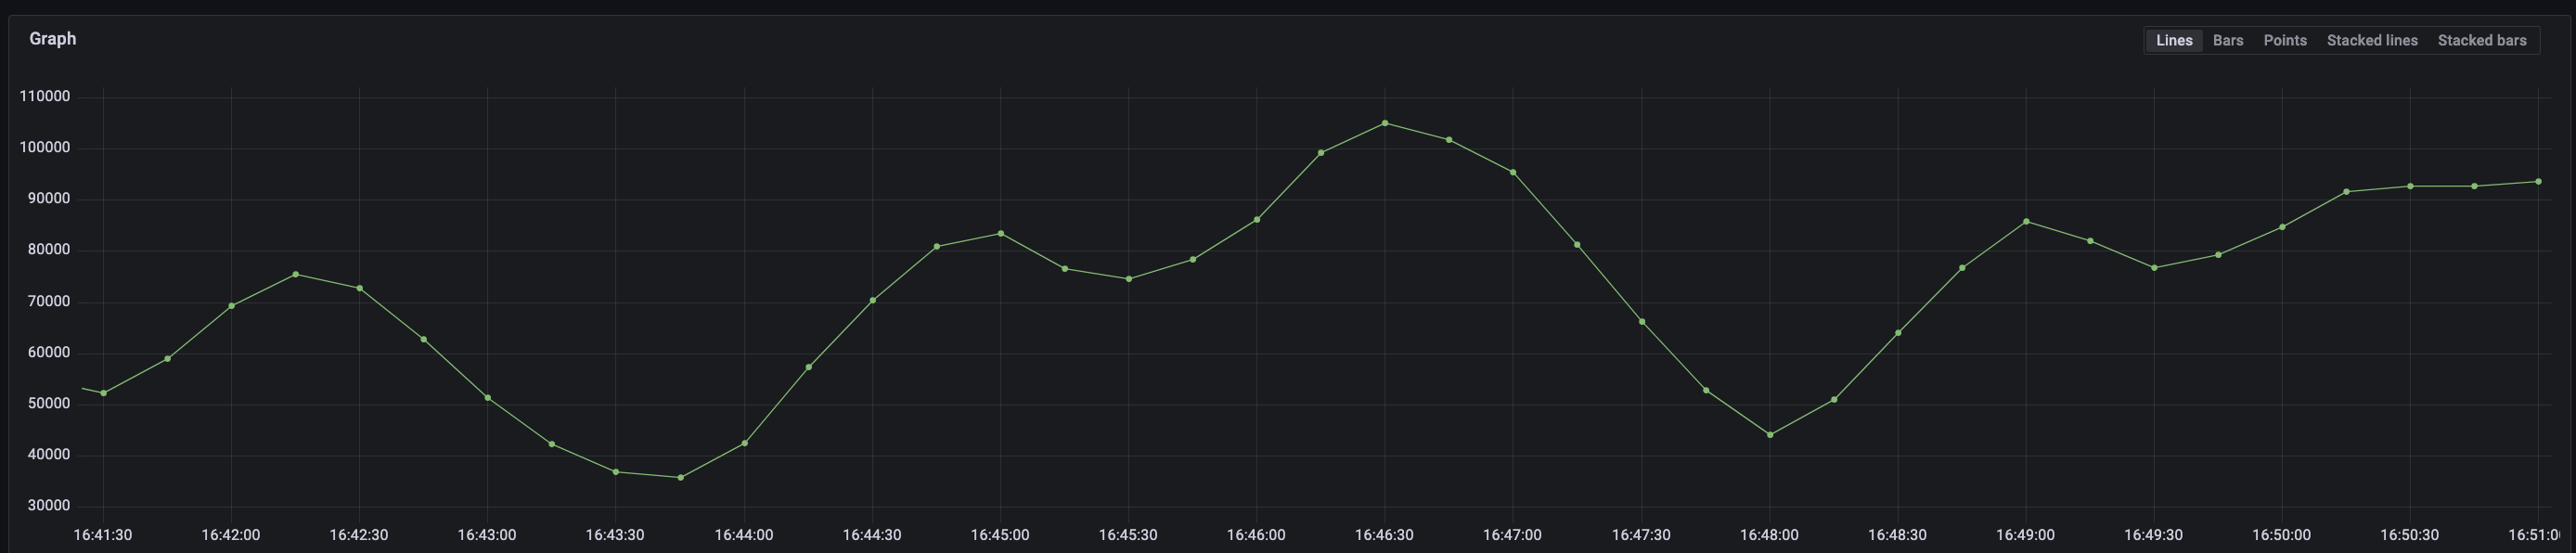
The sharded aggregation rate calculation always puts out these “Charlie Brown” shaped graphs.
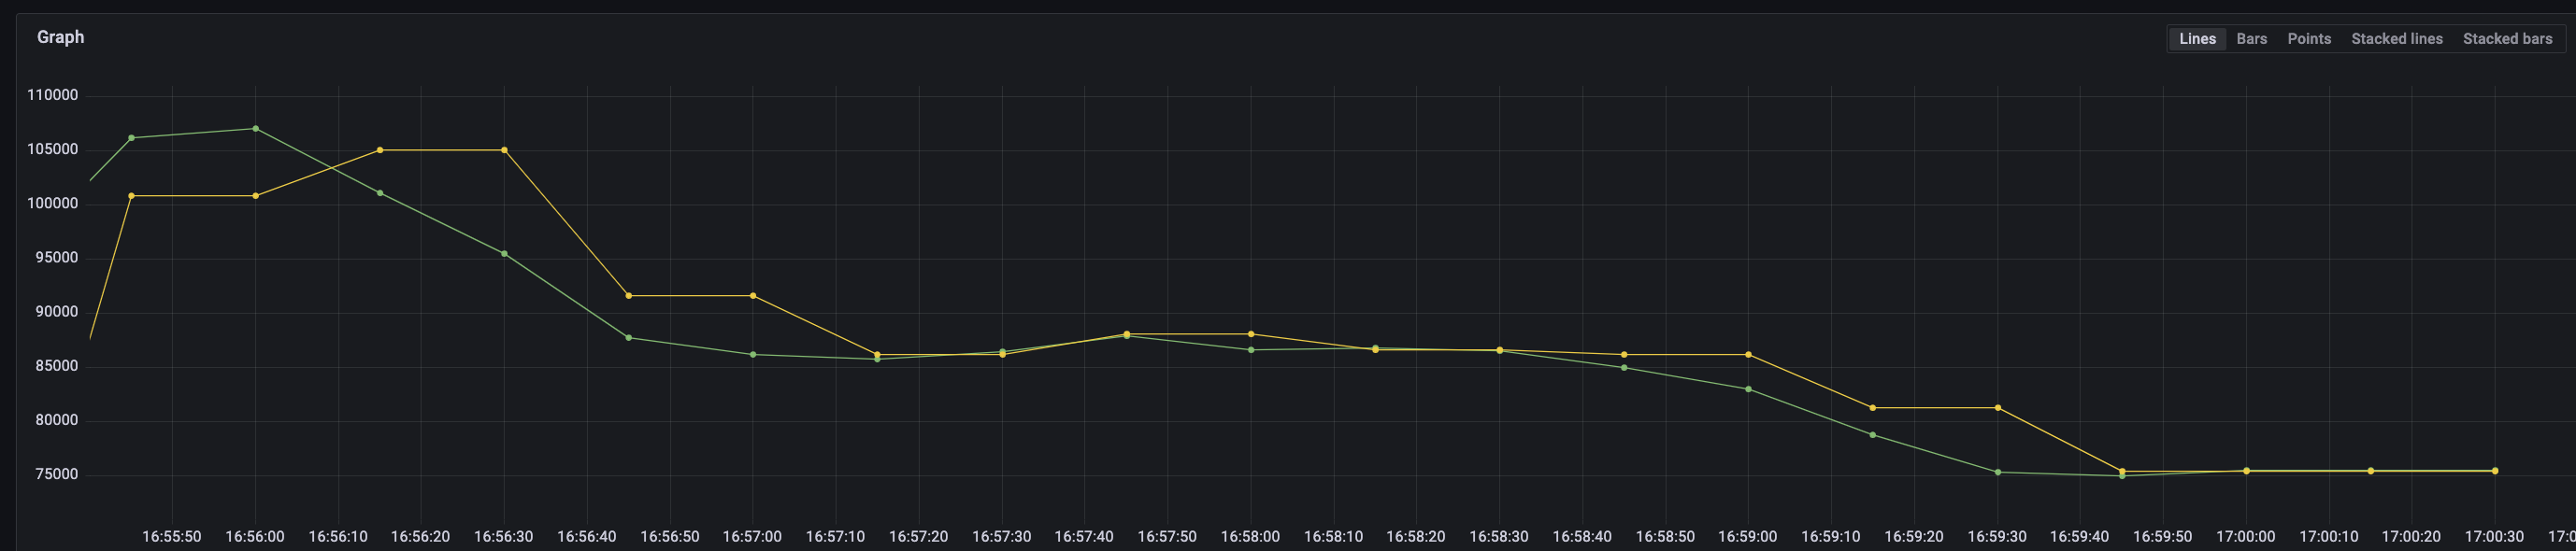
A workaround to this is to add a label to each shard, I did this with the following:
--remoteWrite.label=vmagent=%{HOSTNAME}
After that, the original and aggregated data are aligned:
To Reproduce
apiVersion: operator.victoriametrics.com/v1beta1
kind: VMAgent
metadata:
  name: vmagent
  namespace: monitoring
spec:
  image:
    tag: v1.90.0
  selectAllByDefault: true
  scrapeInterval: "30s"
  replicaCount: 1
  shardCount: 4
  logFormat: json
  resources:
    requests:
      cpu: "2.5"
      memory: "3Gi"
  extraArgs:
    # remoteWrite.label: "vmagent=%{HOSTNAME}"
  remoteWrite:
    - url: "http://my_vm/insert/0/prometheus/api/v1/write"
      sendTimeout: "2m"
      streamAggrConfig:
        keepInput: false
        rules:
          - match: '{__name__=~"input_.+"}'
            interval: "30s"
            outputs: ["total","sum_samples"]
            without: ["pod", "instance"]
Version
v1.90.0
Logs
No response
Screenshots
No response
Used command-line flags
No response
Additional information
No response
About this issue
- Original URL
- State: closed
- Created a year ago
- Reactions: 1
- Comments: 16 (2 by maintainers)
Commits related to this issue
- labels from `remoteWrite.label` are now added to sent metrics just before they are pushed to `remoteWrite.url` after all relabelings, including stream aggregation relabelings (#4247) Signed-off-by: A... — committed to VictoriaMetrics/VictoriaMetrics by Amper a year ago
- fixed applying `remoteWrite.label` for pushed metrics (#4247) (#4824) vmagent: properly add extra labels before sending data to remote storage labels from `remoteWrite.label` are now added to sent... — committed to VictoriaMetrics/VictoriaMetrics by Amper a year ago
- fixed applying `remoteWrite.label` for pushed metrics (#4247) (#4824) vmagent: properly add extra labels before sending data to remote storage labels from `remoteWrite.label` are now added to sent m... — committed to VictoriaMetrics/VictoriaMetrics by Amper a year ago
- fixed premature release of the context (after #4247 / #4824) Signed-off-by: Alexander Marshalov <_@marshalov.org> — committed to VictoriaMetrics/VictoriaMetrics by Amper 10 months ago
- fixed premature release of the context (after #4247 / #4824) Signed-off-by: Alexander Marshalov <_@marshalov.org> — committed to VictoriaMetrics/VictoriaMetrics by Amper 10 months ago
- vmagent: fixed premature release of the context (after #4247 / #4824) (#4849) Follow-up after https://github.com/VictoriaMetrics/VictoriaMetrics/commit/a27c2f37731986f4bf6738404bb6388b1f42ffde htt... — committed to VictoriaMetrics/VictoriaMetrics by Amper 10 months ago
- vmagent: fixed premature release of the context (after #4247 / #4824) (#4849) Follow-up after https://github.com/VictoriaMetrics/VictoriaMetrics/commit/a27c2f37731986f4bf6738404bb6388b1f42ffde https... — committed to VictoriaMetrics/VictoriaMetrics by Amper 10 months ago
- app/vmagent/remotewrite: follow-up after a27c2f37731986f4bf6738404bb6388b1f42ffde - Fix Prometheus-compatible naming after applying the relabeling if -usePromCompatibleNaming command-line flag is set... — committed to VictoriaMetrics/VictoriaMetrics by valyala 10 months ago
- app/vmagent/remotewrite: follow-up after a27c2f37731986f4bf6738404bb6388b1f42ffde - Fix Prometheus-compatible naming after applying the relabeling if -usePromCompatibleNaming command-line flag is set... — committed to VictoriaMetrics/VictoriaMetrics by valyala 10 months ago
- fixed applying `remoteWrite.label` for pushed metrics (#4247) (#4824) vmagent: properly add extra labels before sending data to remote storage labels from `remoteWrite.label` are now added to sent m... — committed to VictoriaMetrics/VictoriaMetrics by Amper a year ago
- vmagent: fixed premature release of the context (after #4247 / #4824) (#4849) Follow-up after https://github.com/VictoriaMetrics/VictoriaMetrics/commit/a27c2f37731986f4bf6738404bb6388b1f42ffde htt... — committed to VictoriaMetrics/VictoriaMetrics by Amper 10 months ago
- app/vmagent/remotewrite: follow-up after a27c2f37731986f4bf6738404bb6388b1f42ffde - Fix Prometheus-compatible naming after applying the relabeling if -usePromCompatibleNaming command-line flag is set... — committed to VictoriaMetrics/VictoriaMetrics by valyala 10 months ago
- docs/stream-aggregation.md: clarify the usage of `-remoteWrite.label` after the fix at a27c2f37731986f4bf6738404bb6388b1f42ffde Updates https://github.com/VictoriaMetrics/VictoriaMetrics/issues/4247 — committed to VictoriaMetrics/VictoriaMetrics by valyala 10 months ago
- docs/stream-aggregation.md: clarify the usage of `-remoteWrite.label` after the fix at a27c2f37731986f4bf6738404bb6388b1f42ffde Updates https://github.com/VictoriaMetrics/VictoriaMetrics/issues/4247 — committed to VictoriaMetrics/VictoriaMetrics by valyala 10 months ago
- docs/stream-aggregation.md: clarify the usage of `-remoteWrite.label` after the fix at a27c2f37731986f4bf6738404bb6388b1f42ffde Updates https://github.com/VictoriaMetrics/VictoriaMetrics/issues/4247 — committed to VictoriaMetrics/VictoriaMetrics by valyala 10 months ago
- docs/stream-aggregation.md: clarify the usage of `-remoteWrite.label` after the fix at a27c2f37731986f4bf6738404bb6388b1f42ffde Updates https://github.com/VictoriaMetrics/VictoriaMetrics/issues/4247 — committed to VictoriaMetrics/VictoriaMetrics by valyala 10 months ago
- lib/promscrape: add -promscrape.cluster.memberLabel command-line flag This flag allows specifying an additional label to add to all the scraped metrics. The flag must contain label name to add. The l... — committed to VictoriaMetrics/VictoriaMetrics by valyala 10 months ago
Hey there. The problem @Maybeee233 wrote about is indeed reproducible. The point is that the current position of
remoteWrite.labelin the metric’s relabeling lifecycle is highlighted in red in the diagram:This causes this label to be deleted at one of the later stages of relabeling, and it is also removed from the aggregate if it is not specified in the
byfield.Judging by the comments in the source code it is justified by compatibility with Prometheus:
https://github.com/VictoriaMetrics/VictoriaMetrics/blob/c36259fca5ae9c8e58e9d6c56512cdcbedd091c3/app/vmagent/remotewrite/relabel.go#L90-L110
This refers to the following phrase in the Prometheus documentation:
But the problem is that the above function doesn’t apply to
extra_labels(frompromscrape.config), it only applies toremoteWrite.labelhere:https://github.com/VictoriaMetrics/VictoriaMetrics/blob/c36259fca5ae9c8e58e9d6c56512cdcbedd091c3/app/vmagent/remotewrite/remotewrite.go#L390
As for me, applying
remoteWrite.labelat this point looks like an error, but changing the behavior of this option now would be breaking.Bottom line: In its current form, this workaround will only work if you additionally specify this label in the
byfield for every aggregation.@hagen1778 wdyt?
@Amper would you mind checking about the correct usage of ENV variables in the config mentioned by @Maybeee233 ? I believe this case should be related to the docs update we discussed earlier.
@mbrancato @hagen1778
Yes, the problem does occur and is related to the fact that the same timeseries (because of the relabeling) with different intermediate value is pushed from different vmagent shards and written to the storage with different timestamps - as a result:
Proposed solution:
vmagent_shard_num) to aggregated timeseries with the shard number (only on the sharded agents)We will discuss this proposal with our colleagues and then decide whether we will implement it.
P.S. Exactly the same problem can occur without stream-aggregation if relaybeling is used, which will result in the same series on different agent shards.
I’d expect VM still summarise them correctly, even if they have identical labels. The problem would be if their timestamps match identically as well. In this case, VM starts to deduplicate such datapoints. Thanks for the context - I’ll try to reproduce this.