VictoriaMetrics: Vm scrapping k8s kubernetes_sd_config, time to time data missing
Describe the bug
for targets under kubernetes_sd_configs.
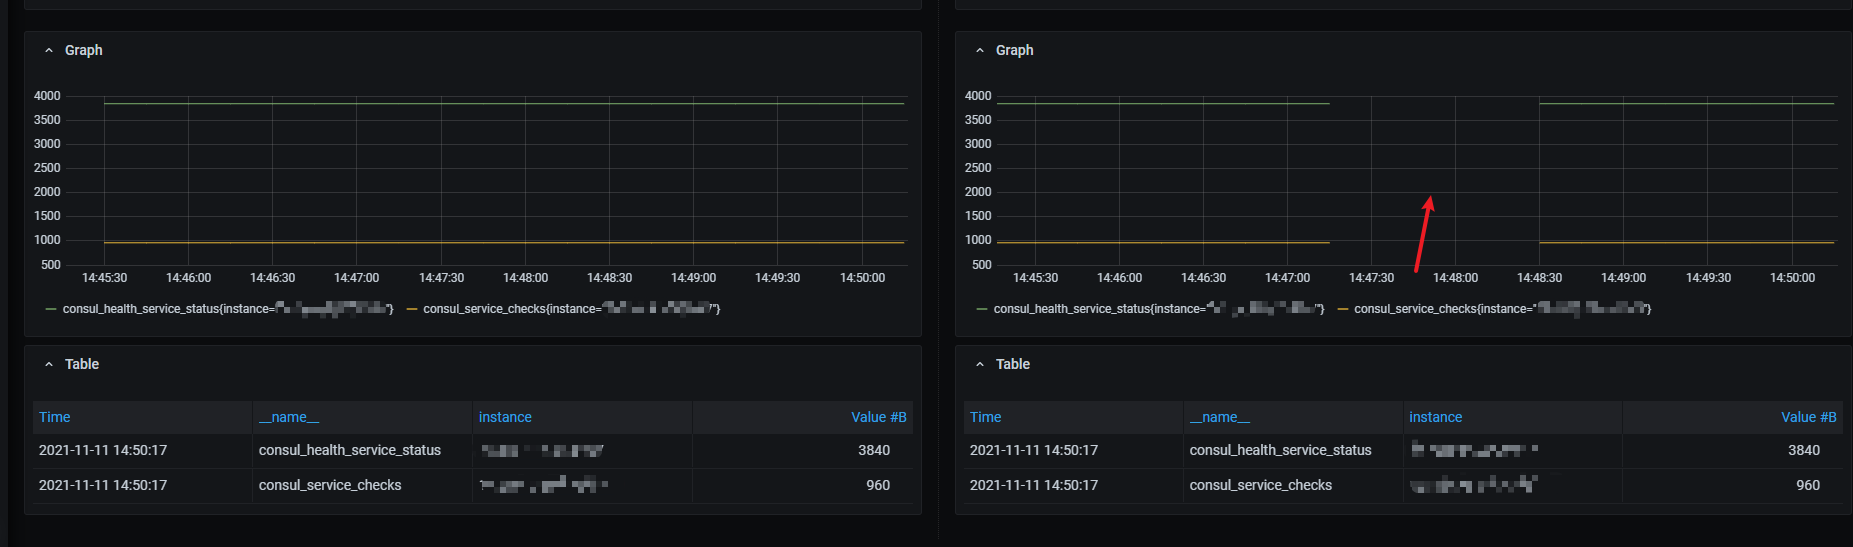
The user reported that data missing from time to time.
And we set up 2 independent clusters that are missing data at different times.
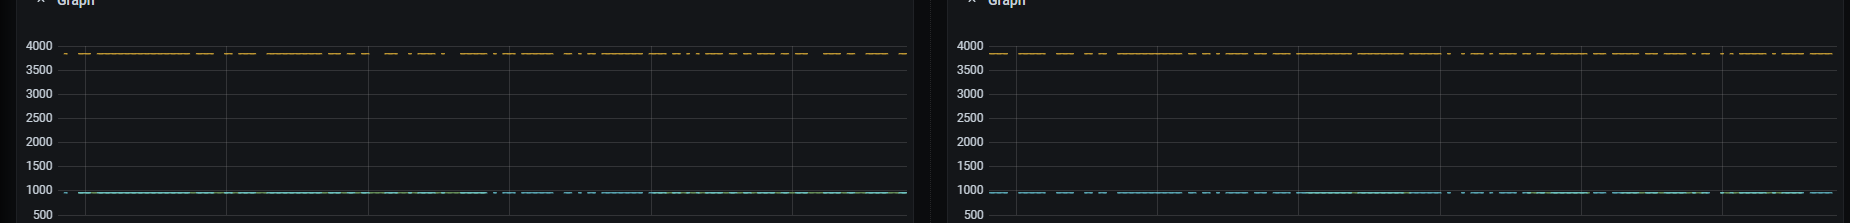
 When losing data there is no target unreachable or marked as
 down
To Reproduce
configuration is
- job_name: kube-state
  honor_timestamps: true
  scrape_interval: 1m
  scrape_timeout: 10s
  metrics_path: /metrics
  scheme: HTTP
  kubernetes_sd_configs:
  - api_server: https://xxxxxxxxxxxxxxxxxxxxxx.xxxxxxx.us-west-2.eks.amazonaws.com
    role: endpoints
    bearer_token_file: /config/eks-center
    tls_config:
      insecure_skip_verify: true
    namespaces:
      names:
      - xxxxxxxxx
Expected behaviour No data losing
Logs no log related to this issue
Version vmagent: vmagent-20211008-135241-tags-v1.67.0-0-g6058edb0d vmstorage: vmstorage-20211008-140613-tags-v1.67.0-cluster-0-g20fa4b01c vmselect: vmselect-20211008-140608-tags-v1.67.0-cluster-0-g20fa4b01c vminsert: vminsert-20211008-140602-tags-v1.67.0-cluster-0-g20fa4b01c
Used command-line flags vmagent:
-promscrape.config=prometheus.yml -remoteWrite.url=xxxxx -http.connTimeout=1000ms -promscrape.maxScrapeSize=250MB -promscrape.suppressDuplicateScrapeTargetErrors -promscrape.cluster.membersCount=9 -promscrape.cluster.memberNum=0 -promscrape.streamParse=true -promscrape.consulSDCheckInterval=60s -remoteWrite.queues=10 -promscrape.cluster.replicationFactor=2
vmselect:
-dedup.minScrapeInterval=13s -search.logSlowQueryDuration=15s -search.maxQueryDuration=50s -cacheDataPath=/logs -search.maxQueryLen=1MB -storageNode=......
vminsert:
-replicationFactor=2 -maxLabelsPerTimeseries=50 -storageNode=....
vmstorage:
-search.maxUniqueTimeseries=2000000 -storageDataPath=/lingtian/opt/vmstorage-data -retentionPeriod=1y -bigMergeConcurrency=1
About this issue
- Original URL
- State: closed
- Created 3 years ago
- Comments: 20 (5 by maintainers)
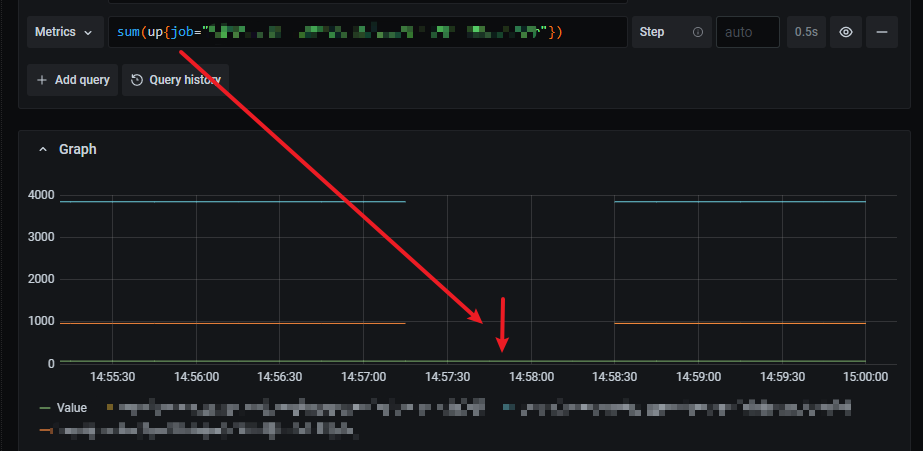
vmagentwas using its own generated timestamps for scraped metrics until v1.68.0 unlesshonor_timestamps: trueconfig option was set at scrape_config section. This wasn’t compatible with the default Prometheus behaviour, which uses timestamps from scrape target responses by default unlesshonor_timestamps: falseconfig option is explicitly set atscrape_configsection. The behaviour ofvmagenthas been aligned with Prometheus behaviour regarding which timestamps to use starting from v1.68.0.It looks like some scrape targets such as
cadvisorexport its own timestamps for some metrics, and the exported timestamps are out of sync with the current time atvmagent. This may result in gaps on graphs. For example:container_cpu_usage_seconds_total 123 123456789Where 123456789 is a timestamp for the exported metric
container_cpu_usage_seconds_total. vmagent ignored such timestamps by default until v1.68.0. It used its own generated timestamps with scrape time instead. vmagent v1.68.0 and newer versions uses timestamps provided by scrape target by default. This behaviour can be changed by explicitly settinghonor_timestamps: falsein the correspondingscrape_configsection at-promscrape.configfile.The actually stored timestamps for a particular metric can be inspected by exporting raw samples from VictoriaMetrics via
/api/v1/export- see these docs for details.@shusugmt thanks for explanation! It does make sense to me to have such logic 👌 However, I cannot fix gaps by setting
on my
vmselectpods withhonor_timestampsenabledI also tried to configure
-query.lookback-deltato30son Prometheus end, and no gaps appearedfor now, only
honor_timestamps: falsehelps to remove gaps on graphs@Vladikamira What value are you setting for
-query.lookback-deltaflag in prometheus setup? The way of handling missing data points is different between VM and prometheus, and that maybe the cause of this difference I think. VM uses a smarter method which is described at here but because of this leads having much shorter lookback-delta = 30s compared to the default of 5min in prometheus if you are scraping 15s interval.So maybe if you set
-query.lookback-deltaset to 30s-ish value, eventually start seeing gaps also in prometheus graph?