vector: Possible Memory Leak for K8s logs
A note for the community
- Please vote on this issue by adding a 👍 reaction to the original issue to help the community and maintainers prioritize this request
- If you are interested in working on this issue or have submitted a pull request, please leave a comment
Problem
Description of the environment
There is vector DaemonSet in the k8s cluster, each Pod collects k8s logs
Expectation
After upgrading Vector from 0.20.0 to 0.21.2 there is not much difference in memory usage
Actuall Outcome
On some nodes, Vector memory usage keeps linearly increasing causing them to be OOM-Killed by k8s. The same issue persists in all versions including 0.24.1
Memory usage graphs
Updated version at ~11:20
All pods

Problematic Pods

Configuration
# Vector's API for introspection
    [api]
      enabled = true
      address = "0.0.0.0:yyyy"

    # Read Kubernetes logs from files
    [sources.kube_logs_1]
      type = "kubernetes_logs"
      exclude_paths_glob_patterns = ["xxx"]
      annotation_fields.container_name = "container_name"
      annotation_fields.container_image = "container_image"
      annotation_fields.pod_ip = "pod_ip"
      annotation_fields.pod_name = "pod_name"
      annotation_fields.pod_namespace = "namespace_name"
      annotation_fields.pod_node_name = "pod_node_name"
      annotation_fields.pod_uid = "pod_uid"

    # Transform Kube logs and remove unused fields
    [transforms.kube_logs_remapped]
      type = "remap"
      inputs = ["kube_logs_1"]
      source = '''
      .full_message = .message
      .message = "pod_stderr_stdout"
      .source = .pod_name
      .node_name = .pod_node_name
      .facility = .container_name
      del(.file)
      del(.pod_node_name)
      del(.kubernetes)
      '''

    # Filter OUT k8s-event-logger events
    [transforms.kube_logs_filtered]
      type = "filter"
      inputs = ["kube_logs_remapped"]
      condition = '.container_name != "k8s-event-logger"'

    # Filter IN k8s-event-logger events
    [transforms.only_k8s_event_logs]
      type = "filter"
      inputs = ["kube_logs_1"]
      condition = '.container_name == "k8s-event-logger"'

    # Transform k8s event logs from JSON
    [transforms.k8s_events_remapped]
      type = "remap"
      inputs = ["only_k8s_event_logs"]
      source = '''
      if is_nullish(.message) == true {
        .message = "No log message attached for k8s-event-logger"
        .facility = "k8s-event-logger"
        abort
      }
      . = parse_json!(.message)
      .facility = "k8s-event-logger"
      .type = .type
      .reason = .reason
      .namespace_name = .metadata.namespace
      .node_name = .source.host
      .source = .involvedObject.name
      .object_kind = .involvedObject.kind
      .object_name = .involvedObject.name
      del(.metadata)
      del(.involvedObject)
      del(.count)
      del(.firstTimestamp)
      del(.lastTimestamp)
      del(.reportingComponent)
      del(.reportingInstance)
      del(.eventTime)
      '''

    # Forward logs to vector-aggregator service
    [sinks.vector_aggr]
      type = "vector"
      inputs = ["k8s_events_remapped", "kube_logs_filtered"]
      address = "x.x.x.x:yyyy"
Version
>=0.21.0-distroless-libc
Debug Output
No response
Example Data
No response
Additional Context
- Vector is deployed as DaemonSet in k8s
- It is collecting k8s logs
References
No response
About this issue
- Original URL
- State: open
- Created 2 years ago
- Reactions: 17
- Comments: 32 (10 by maintainers)
Yes, I can first check the subversions, and then the nightly builds between them. I’ll divide periods into halves to speed up the process, though this still is going take some time.
Thanks @spencergilbert!
I will update to
0.24.2when it becames available and check the behavior.OK, so I talked with @jszwedko and it turns out I’ve completely mixed up when fixes are/were released. I think this should be fixed in
0.24.2(cutting this week) between https://github.com/vectordotdev/vector/issues/14394 and https://github.com/vectordotdev/vector/pull/14423. This should be testable on a nightly image without any custom builds required.Right now that would require a custom build, I believe. CC @jszwedko and @bruceg as another report of metrics not expiring issue.
I have a simular issue of memory leak, opened an issue a couple of months ago, #11025, but the issue persists after upgrading to the last version.
I’m running
0.24.1and haveexpire_metrics_secsset to30, my source are files and my sinks are kafka, the vector memory keeps increasing.It is possible to entirely disable the generation of these metrics to see if this solve the issue?
The Y-axis graph refers to memory usage in MB. Here is the metric of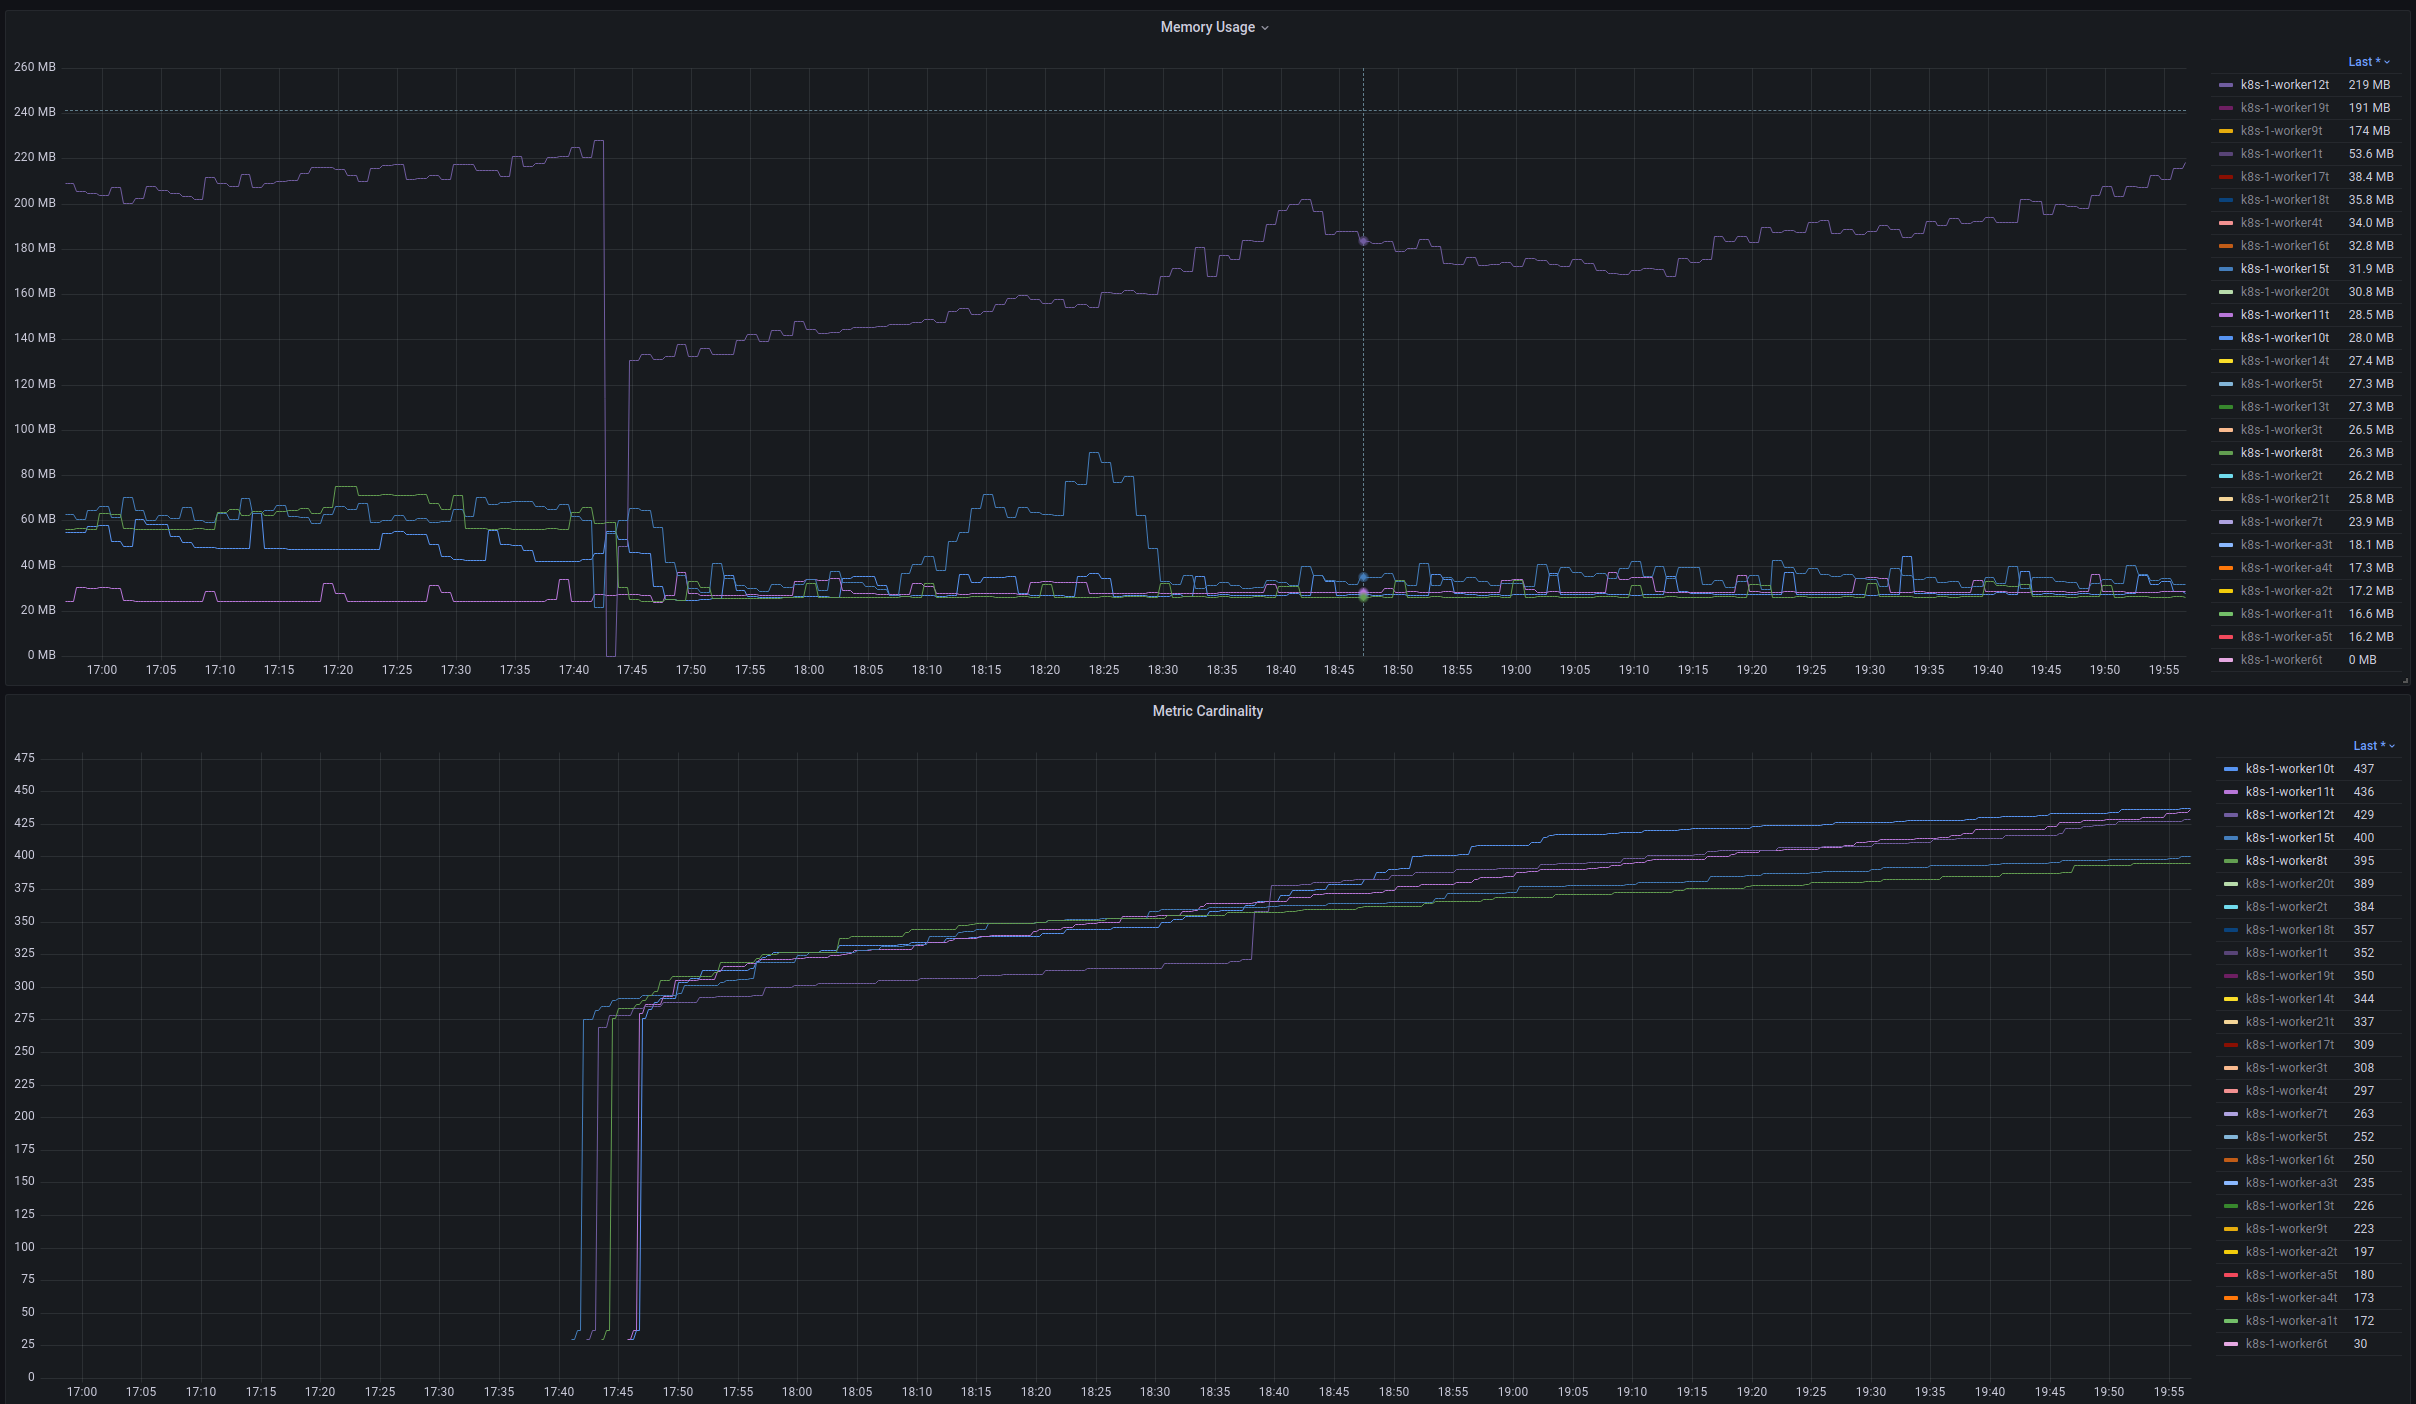
internal_metric_cardinality: Top 5 CardinalityAll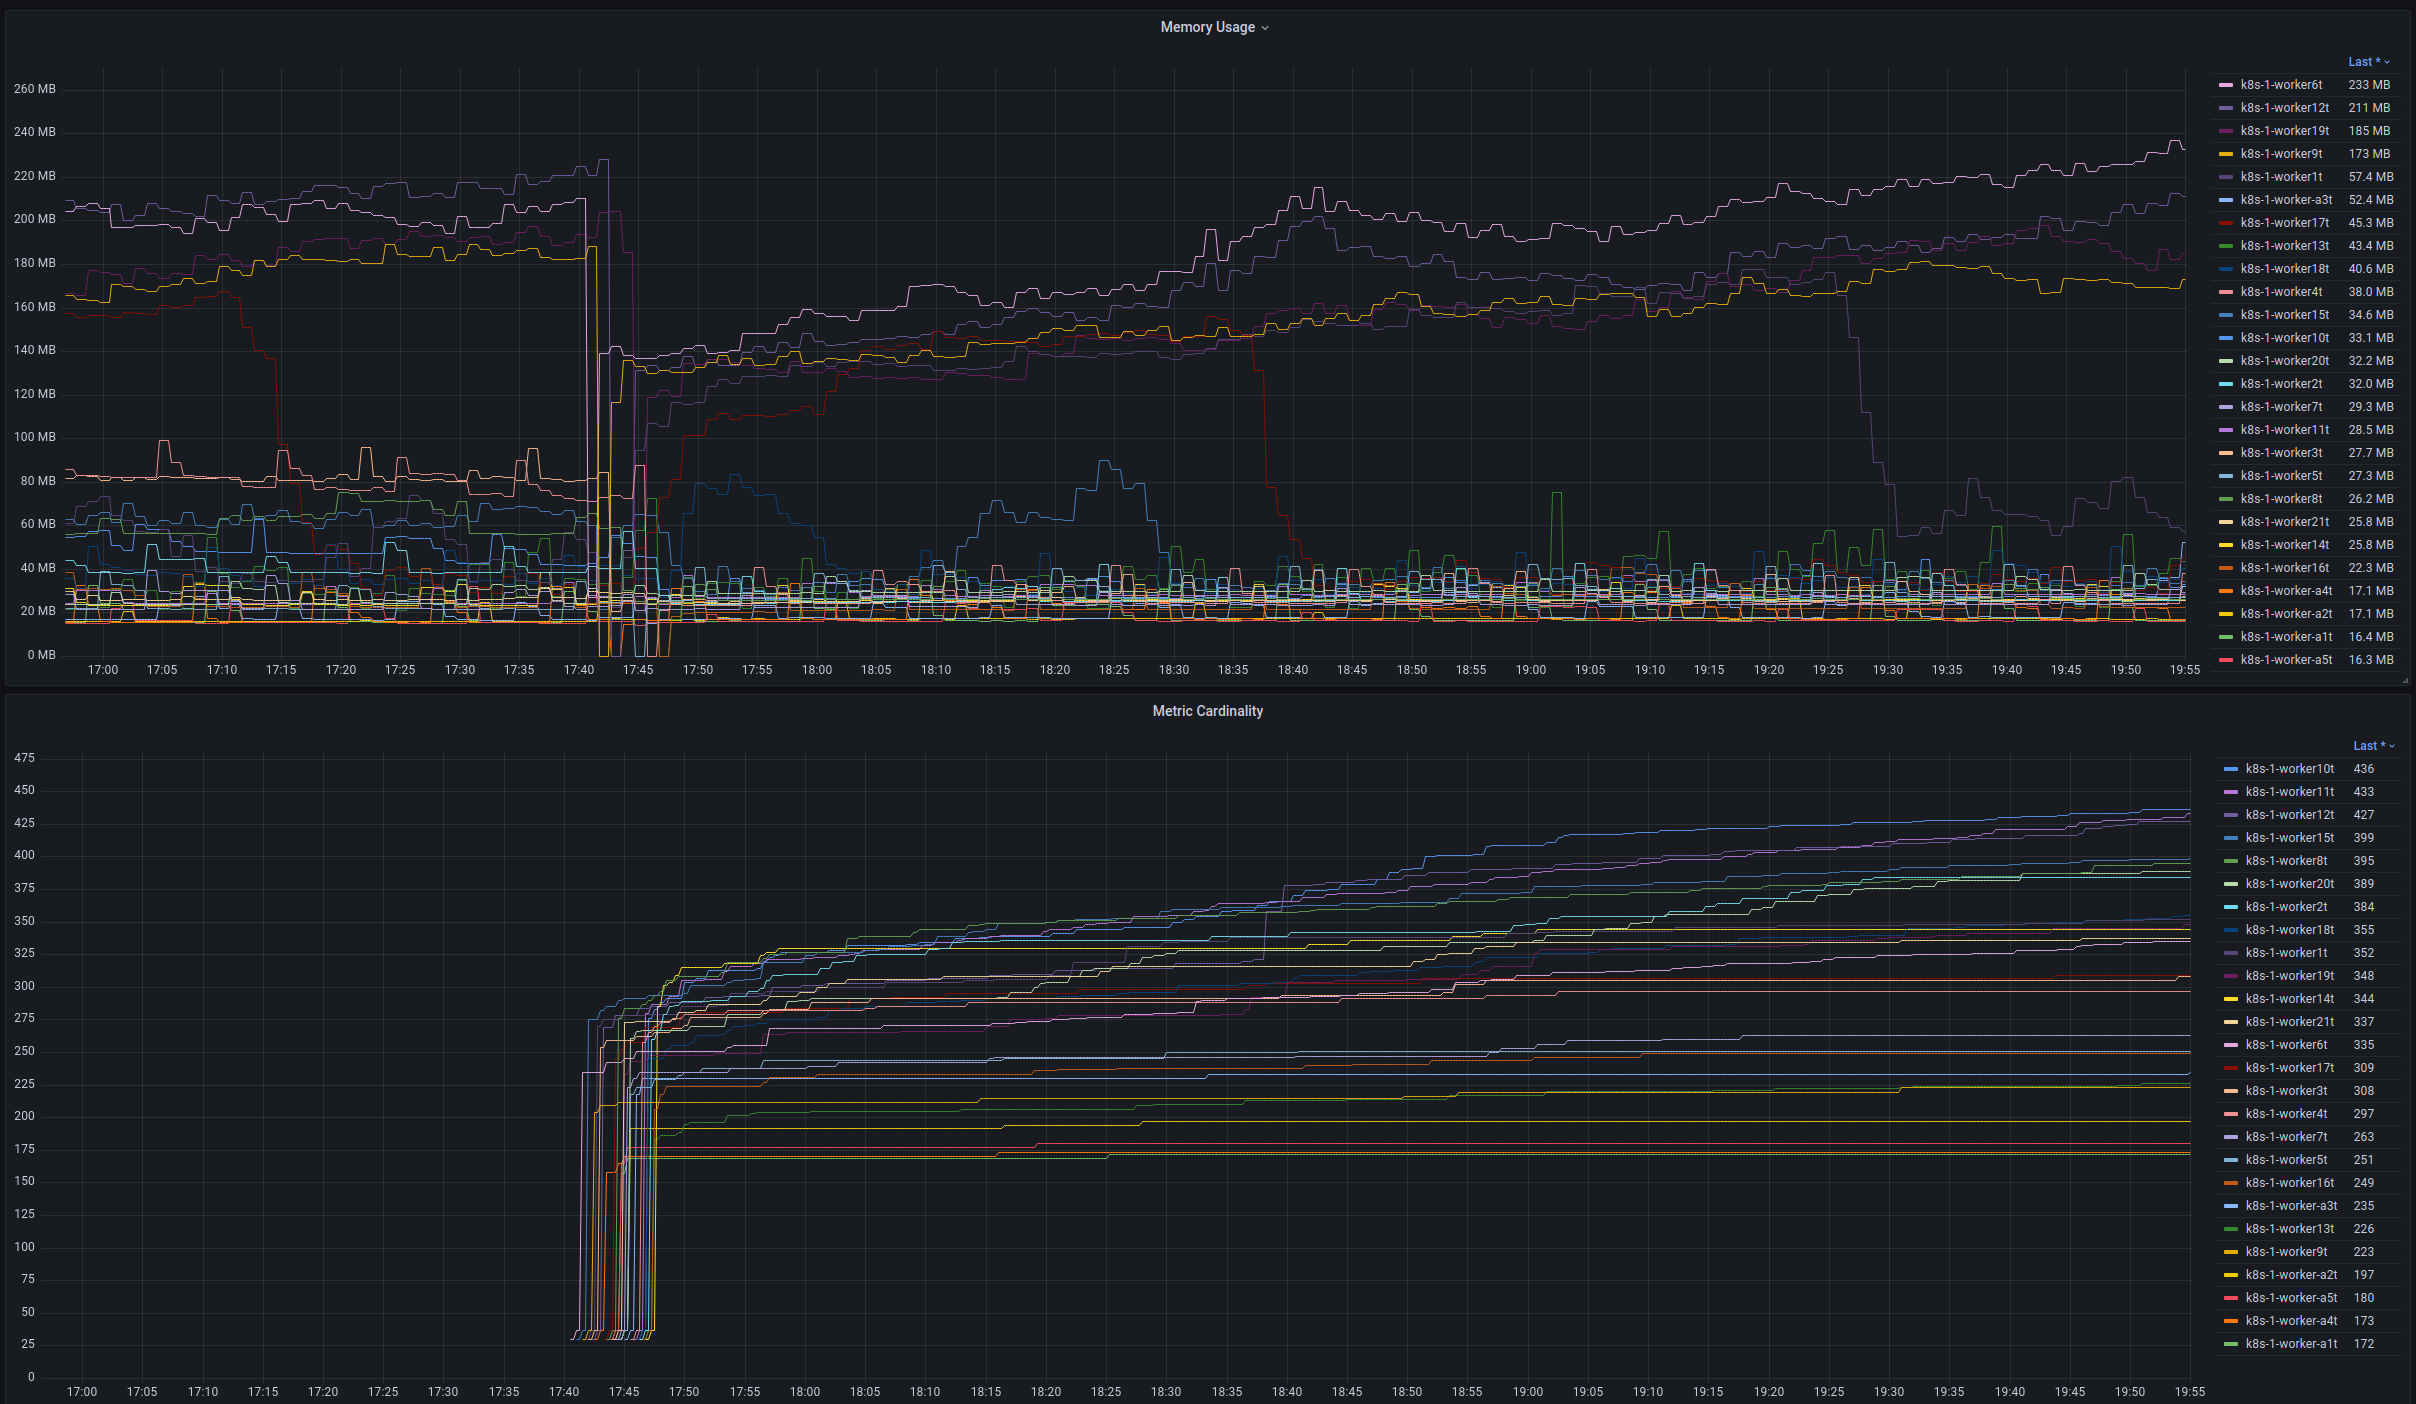
For some reason, cardinality is still increasing all the time, but I don’t see a strong correlation between cardinality and memory usage.