vector: Memory leak in 0.8.2
Good time of the day. We are using vector 0.8.2 (v0.8.2 x86_64-unknown-linux-musl 2020-03-06)
Simplified flow: source.log -> transform.regex -> transform.log_to_metric -> sink.prometheus
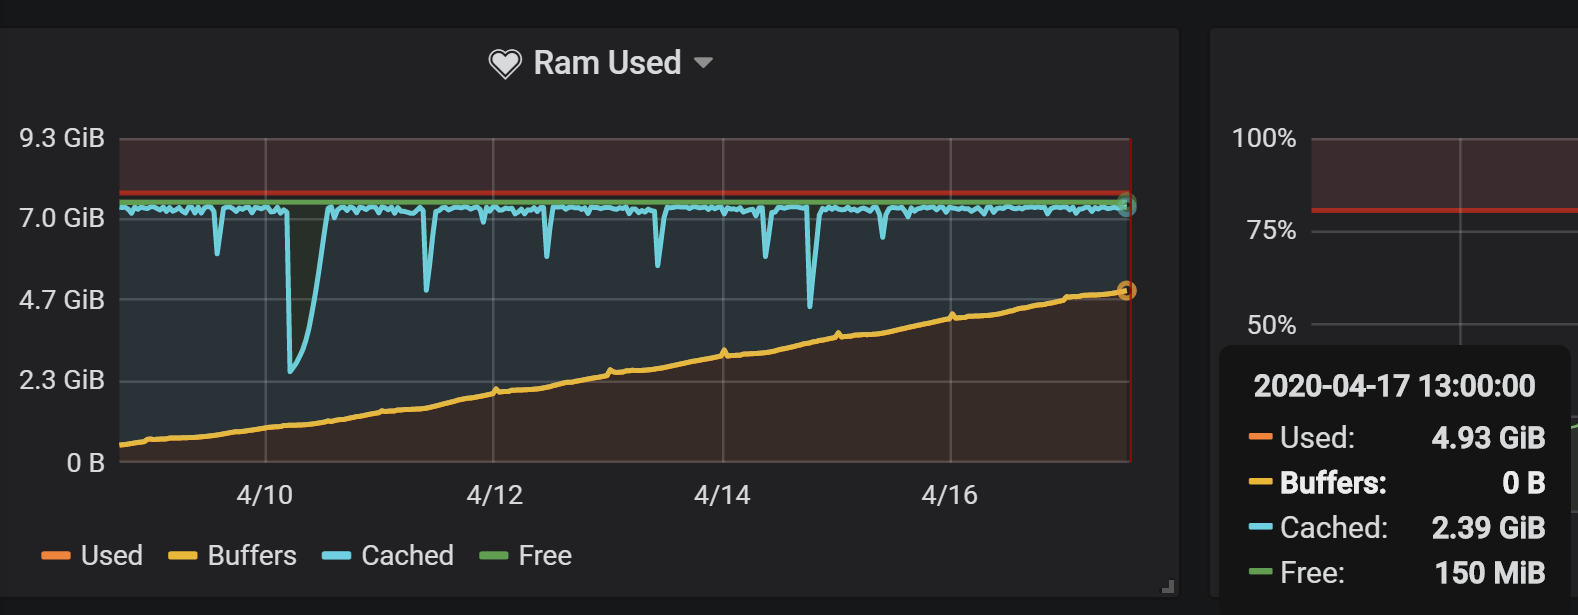
There is some annoying memory leak somewhere. Over the time vector (week or two) can consume up to tens of gigabytes of RAM. We have 10 hosts with identical configuration files. Memory consumption increase correlates with amount of data in logs files.
Memory consumption graph
Configuration file
data_dir = "/var/lib/vector"

# Debug only
#[sources.stdin]
#  type = "stdin"
#[sinks.stdout]
#  inputs   = []
#  type     = "console"
#  encoding = "json"


# Input data
[sources.nginx_log]
  # General
  type = "file"
  include = ["/var/log/nginx/monitoring.log"]
  ignore_older = 3600 # optional, no default, seconds
  start_at_beginning = false # optional, default
  # Priority
  oldest_first = false # optional, default
  # Fingerprinting, how the file source should identify files and changes
  fingerprinting.strategy = "device_and_inode"
  # An approximate limit on the amount of data read from a single file at a given time
  max_read_bytes = 102400

[transforms.nginx_parsed_log]
  # General
  type = "regex_parser" # required
  inputs = ["nginx_log"] # required
  # Classic access_log
  #regex = '^(?P<client_ip>[\w+\.:]+) - [-\w]+ \[(?P<timestamp>.*)\] "(.*?)" (?P<code>\d+) (?P<bytes>\d+).*'
  # Monitoring format - remote_addr [time_local] status body_bytes_sent request_time request_length host
  regex =  '^(?P<client_ip>[\w+\.:]+) \[(?P<timestamp>.*)\] (?P<code>\d+) (?P<bytes>\d+) (?P<request_time>[\d\.]+) (?P<request_length>\d+) (?P<host>.*)'
  drop_field = true # optional, default
  field = "message" # optional, default
  # Types
  #types.client_ip = "string"
  #types.timestamp = "timestamp|%d/%b/%Y:%T %z"
  types.code = "int"
  #types.bytes = "int"
  types.request_time = "float"
  #types.request_length = "int"
  #types.host = "string"


[transforms.nginx_parsed_log_to_metric]
  inputs = ["nginx_parsed_log"]
  type = "log_to_metric"

  [[transforms.nginx_parsed_log_to_metric.metrics]]
    type = "counter"
    field = "code"
    name = "http_requests_total"
    tags.code = "{{ code }}"
    #tags.host = "{{ host }}"

  [[transforms.nginx_parsed_log_to_metric.metrics]]
    type = "histogram"
    field = "request_time"
    name = "http_request_duration_seconds"
    #tags.host = "{{ host }}"

# Output data
[sinks.prometheus]
  type = "prometheus" # required
  inputs = ["nginx_parsed_log_to_metric"] # required
  address = "0.0.0.0:9598" # required
  namespace = "" # required
  flush_period_secs = 15 # optional, default, seconds
About this issue
- Original URL
- State: closed
- Created 4 years ago
- Reactions: 2
- Comments: 23 (18 by maintainers)
Hi @tarabanton, thanks for reporting. We’ll prioritize this and take a look. Nothing jumps out in your configuration file that should cause this. Apologize for the bad experience, we’ll get it resolved!