vector: Incorrect Metric count reported to datadog
I am using log_to_metric transform + datadog_metrics sink, but each metric value of 1 is being reported as 10 in datadog metric explorer.
The metric event correctly shows value 1.0
{"name":"fsm.logline","tags":{"pipeline":"vector","type":"restart"},"kind":"incremental","counter":{"value":1.0}} but when I look at the datadog metric explore, the value reported is 10. I tried a) setting the field to 1 and increment_by_value = true as well but in both cases I am seeing this.
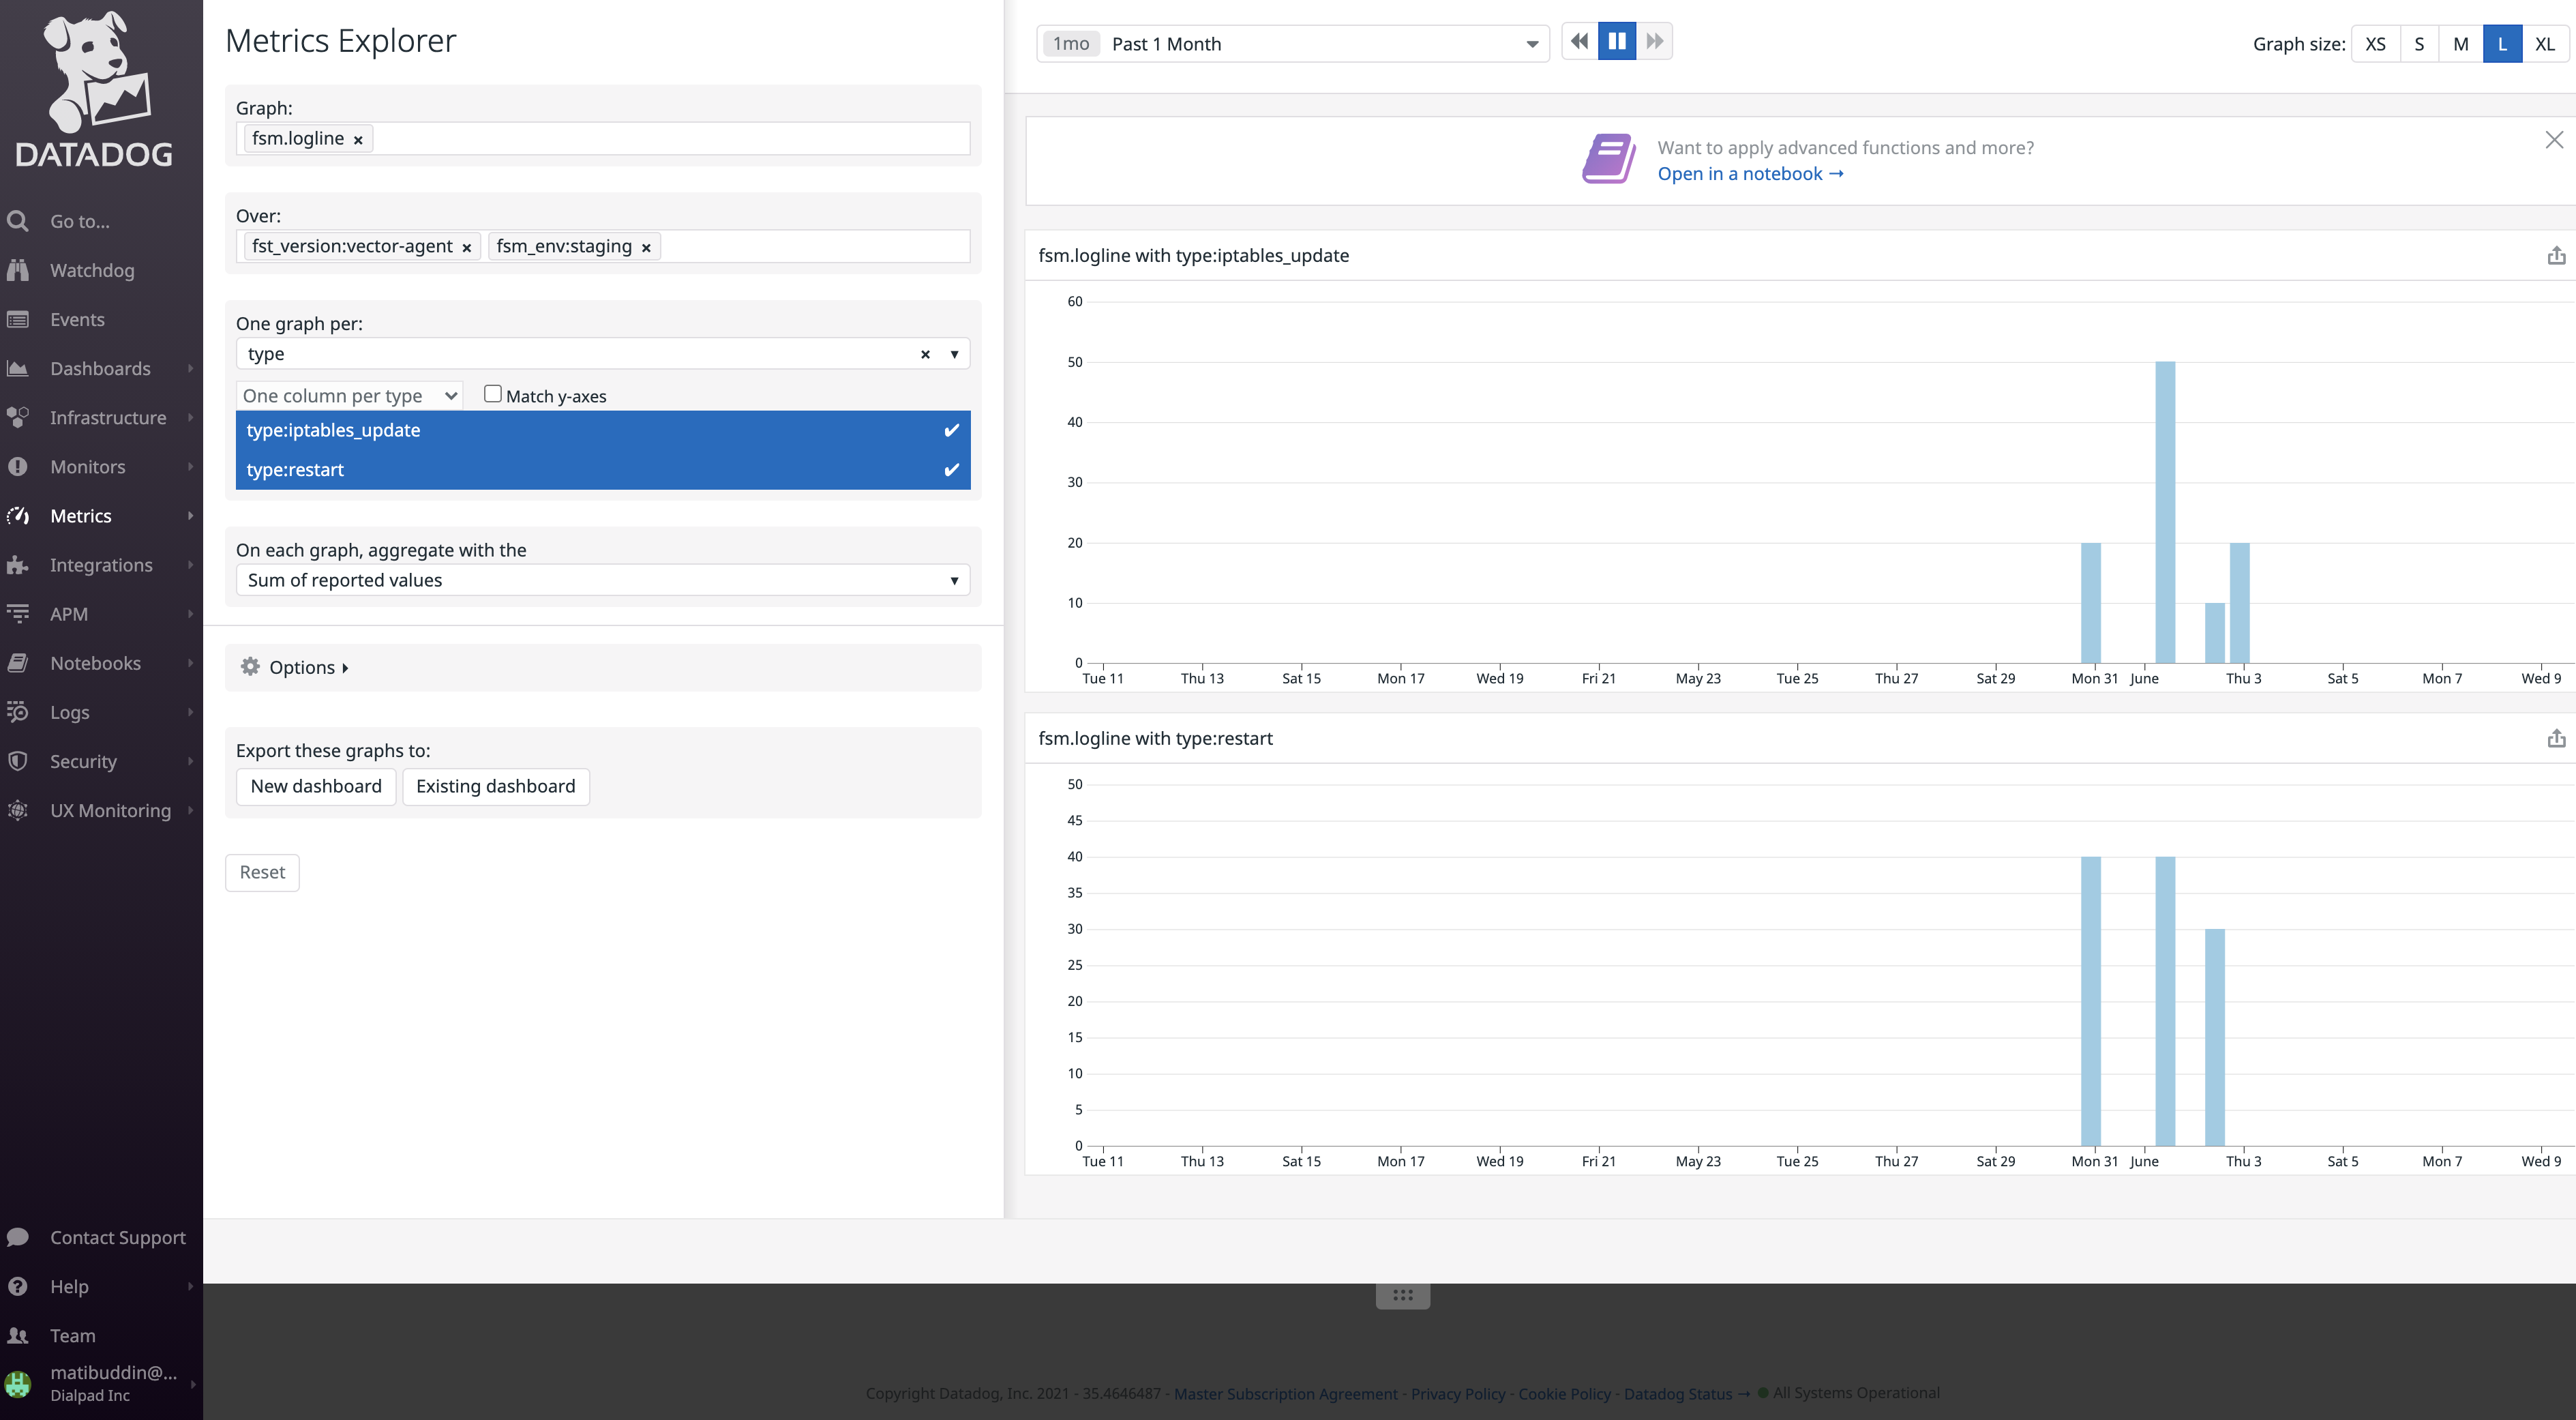
The peaks at 10,20,30,40 in the above image should be just 1,2,3,4…
My config : [sinks.datadog_metrics] type = “datadog_metrics” inputs = [“post_process_metric”] api_key = “<>”
Discussion thread : https://discord.com/channels/742820443487993987/746070591097798688/848136873317629952
About this issue
- Original URL
- State: closed
- Created 3 years ago
- Comments: 17 (9 by maintainers)
Thanks @atibdialpad I’ve been able to reproduce it with
plus a local Datadog agent needs to be running.
To manifest this behavior same metrics (those with the same name) need to be supplied through two different API’s hence this is an issue in DataDog and how it shows metrics. It’s worth noting that this is only an issue of showing those metrics on the same graph since the values are shown correctly if separated, although Metrics Explorer doesn’t always re update the graph. Most likely Metrics Explorer has to combine intervals for two metrics that it sees as equal, and this combining depends on the set of metrics it has to show so the behavior varies.
I’ve also checked if this is a general issue of sending the same metric with different intervals, but it doesn’t seem so.
Solution
This can be addressed on Datadog side cc. @vladimir-dd
Else, users should avoid sending metric with the same name through different APIs. @atibdialpad can you try this out?
@ktff I did look at the metric summary and you are right. The metric_count is only 3 (1 each via dogstream, vector dd metric sink and vector statsd sink)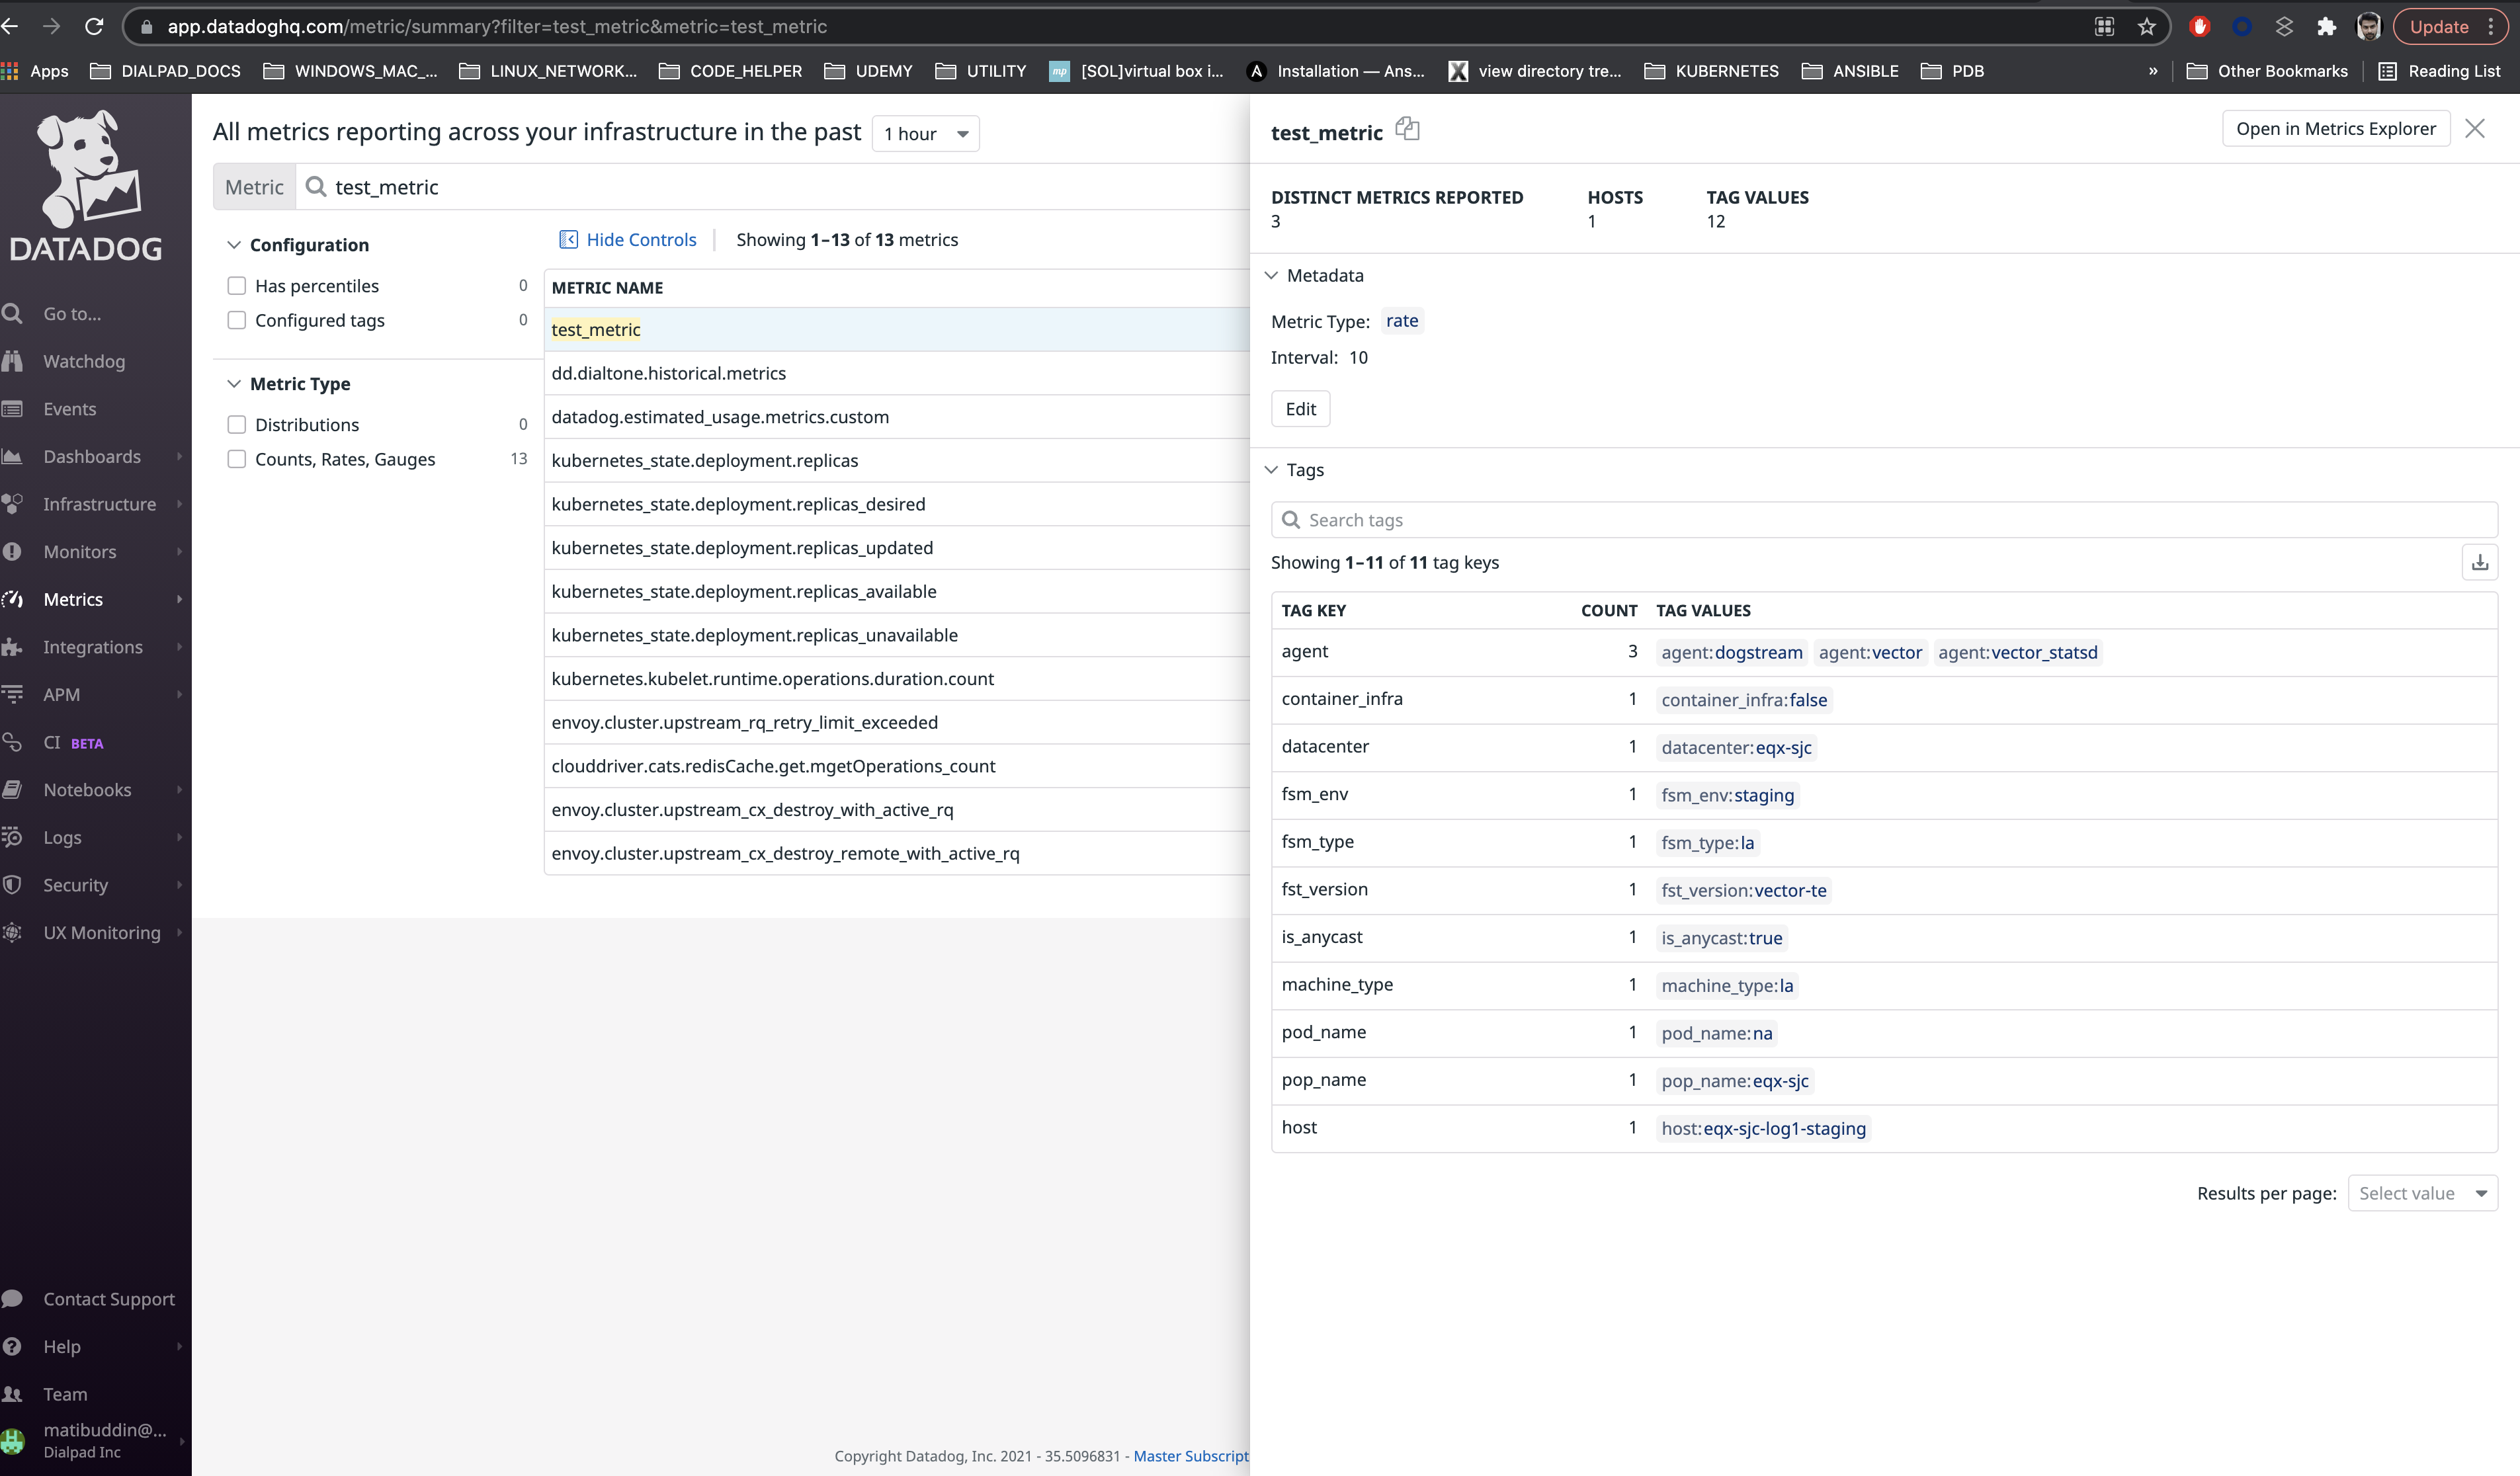
I think the flush period and metric normalisation technique is playing a role here. As the doc https://docs.datadoghq.com/metrics/dogstatsd_metrics_submission/#count says, all counter types metrics are reported by datadog as RATES (= count / flush period of 10 seconds)
So, as soon as the metric is parsed I see this in metric parser : via dogstream and vector statsd = 0.1, via dd metric sink = 1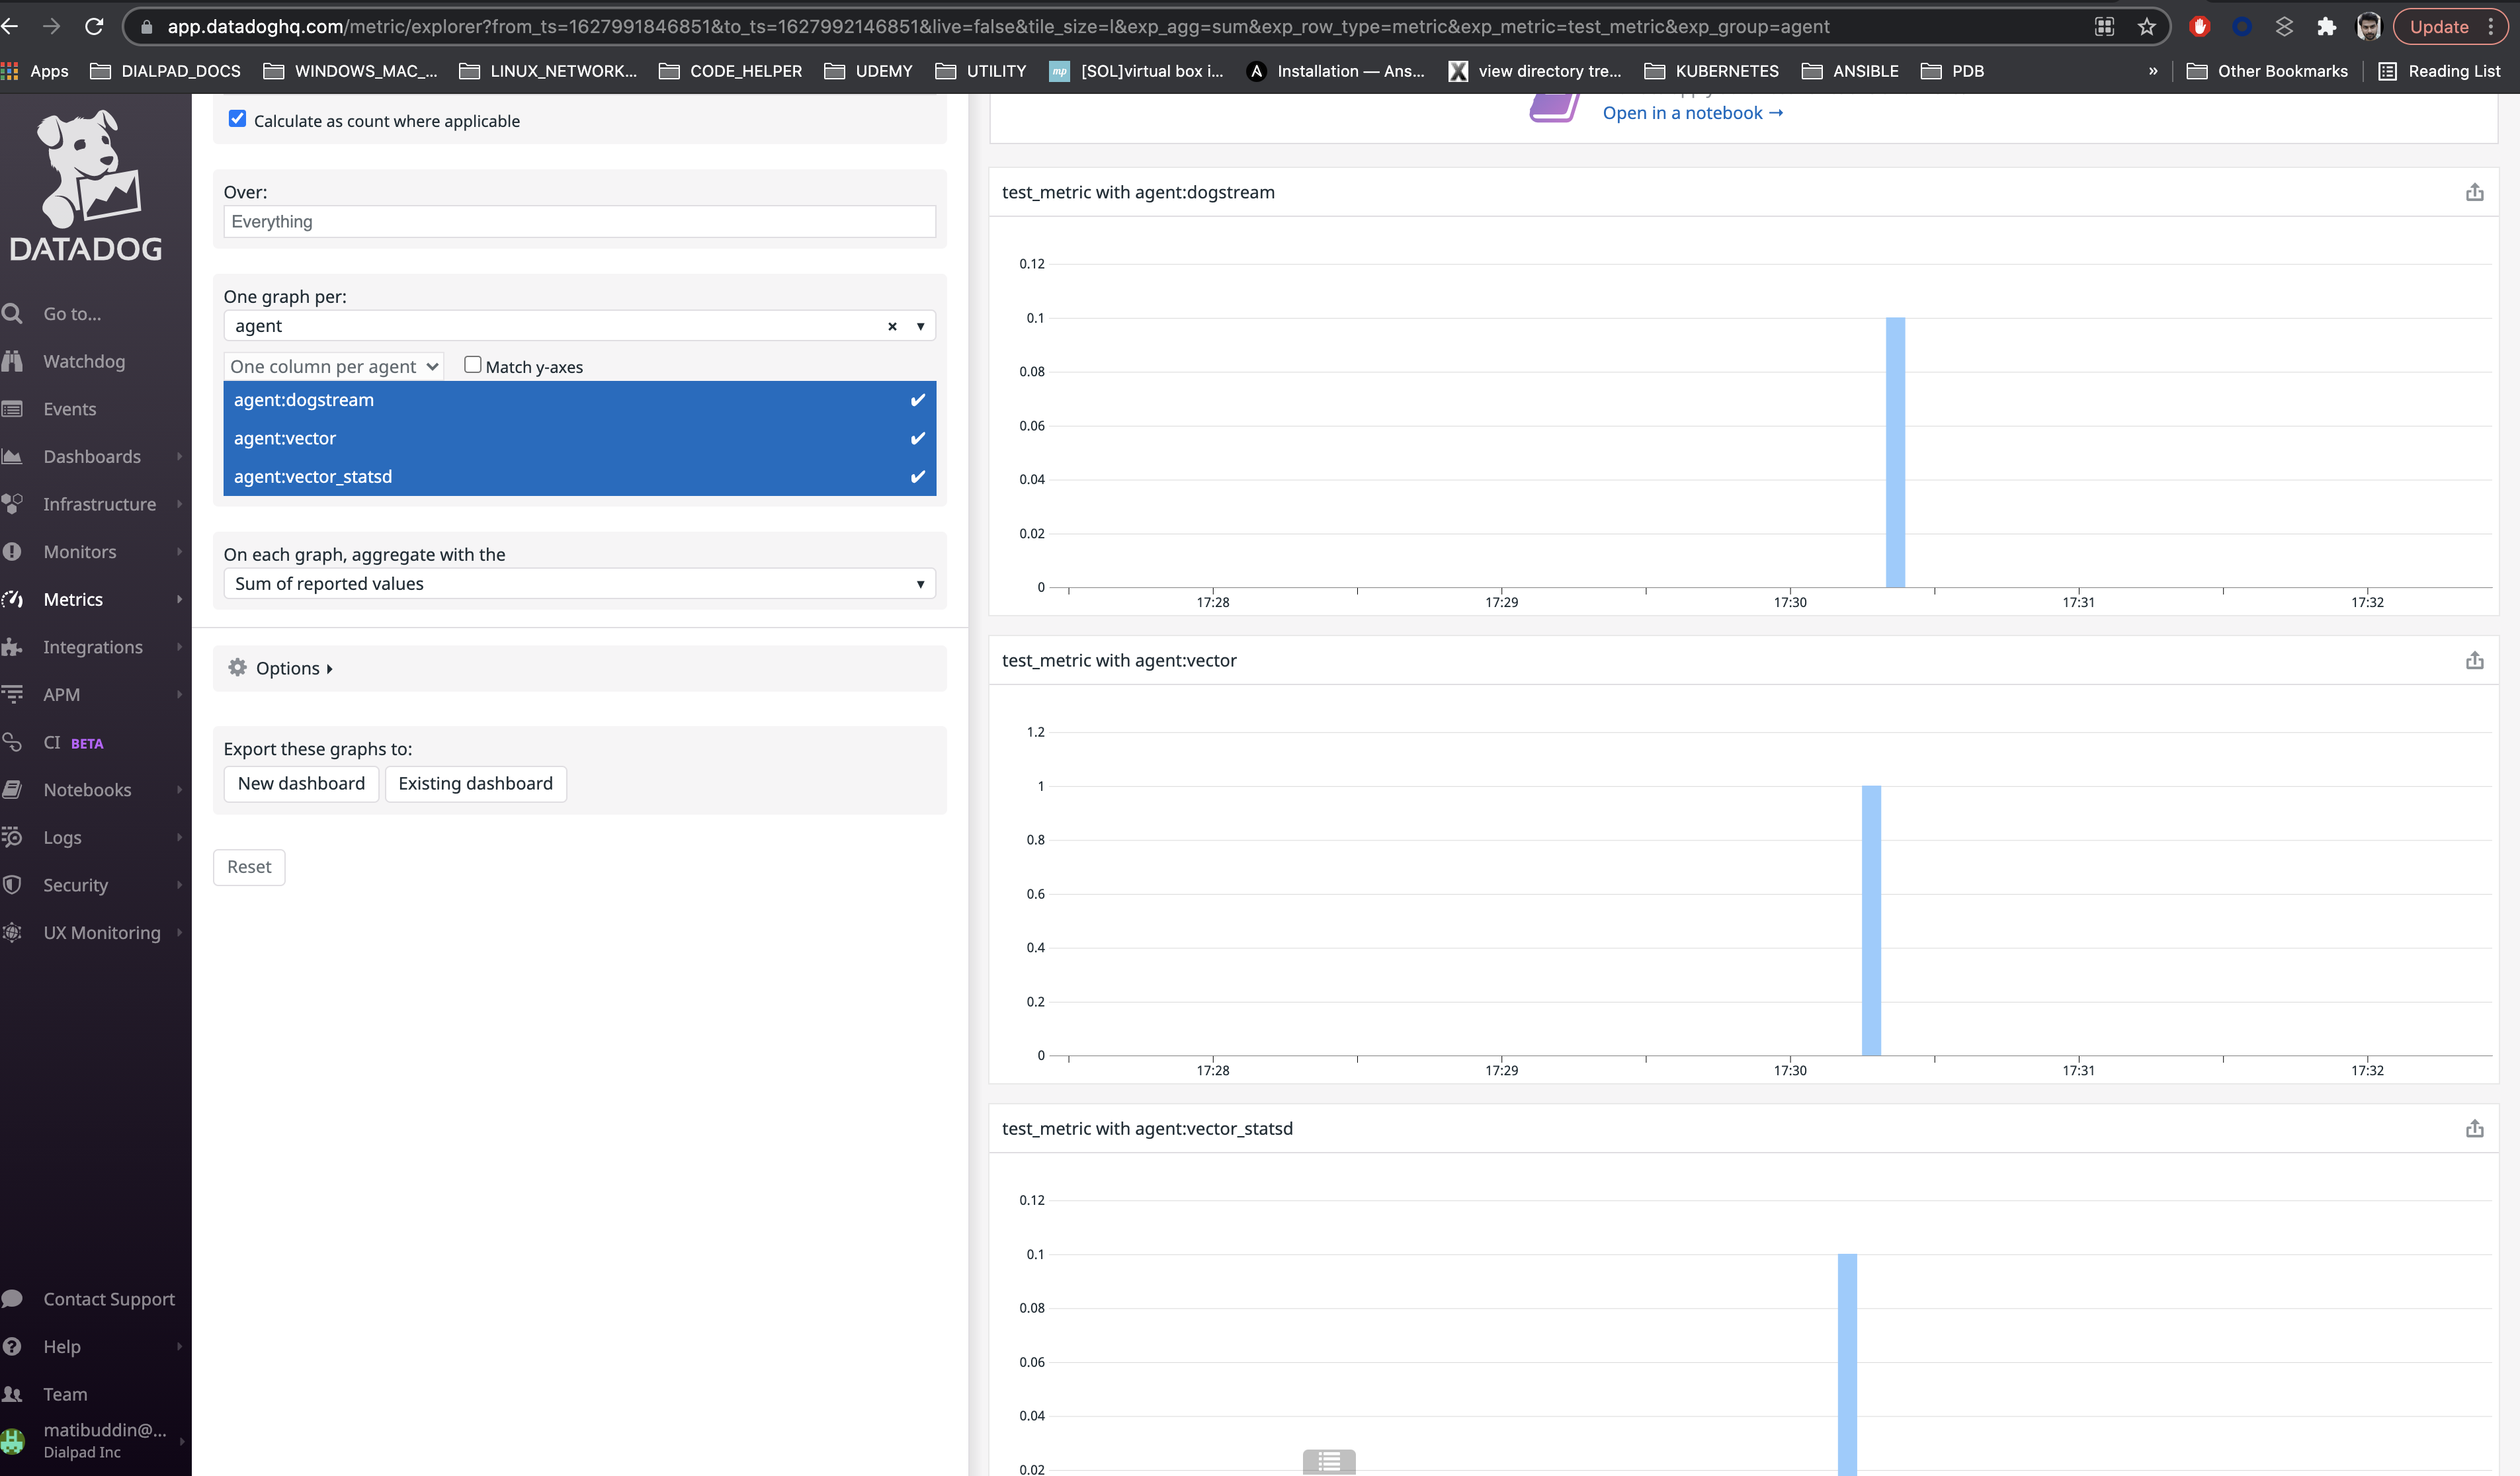
and then after a few seconds it changes to [don’t why this happens] via dogstream and vector statsd = 1, via dd metric sink = 10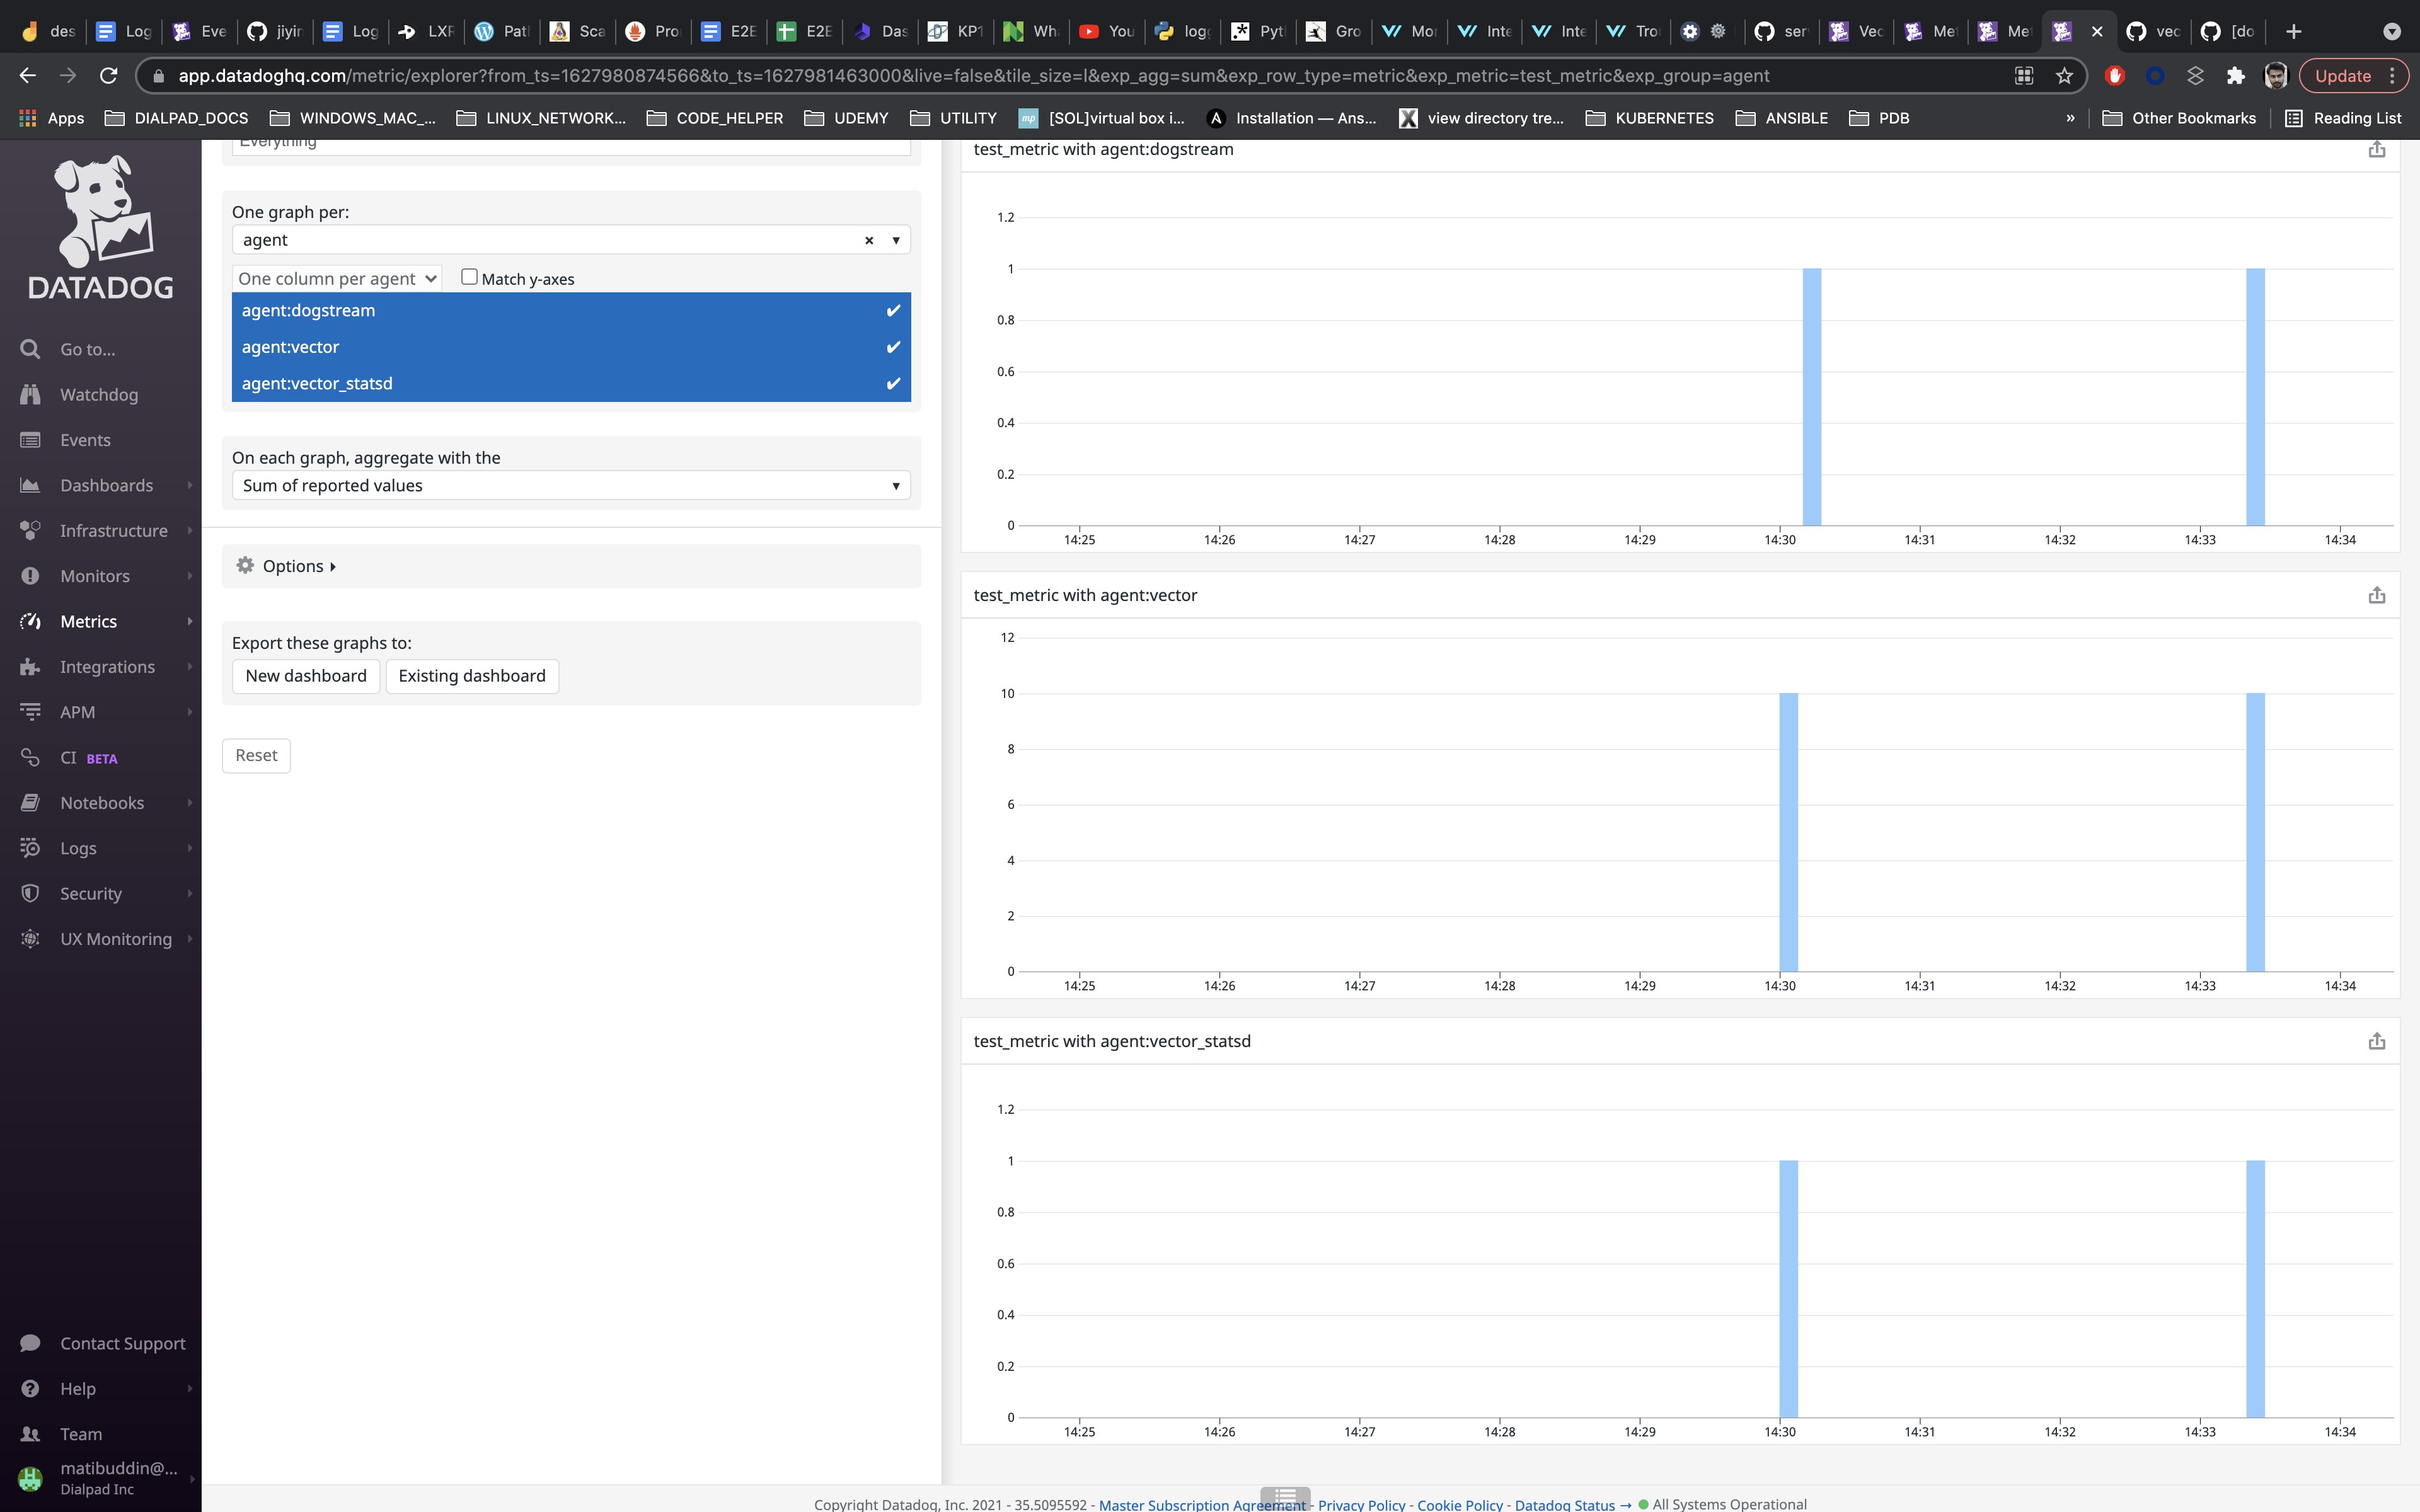
@atibdialpad
Nope.
That shouldn’t be the case going by the config you posted.
That narrows it down then. Then… it could be that some averaging or more generally miss interpretation of data is going on somewhere. Something like we are sending 1 count with interval of 100ms and Datadog is extrapolating that to 10 per second. Could you play a bit with Datadog’s Metrics explorer and see if you can get some different outcome, I’ll also try playing with it.