vector: Datadog source - in and out event count mismatch
A note for the community
- Please vote on this issue by adding a 👍 reaction to the original issue to help the community and maintainers prioritize this request
- If you are interested in working on this issue or have submitted a pull request, please leave a comment
Problem
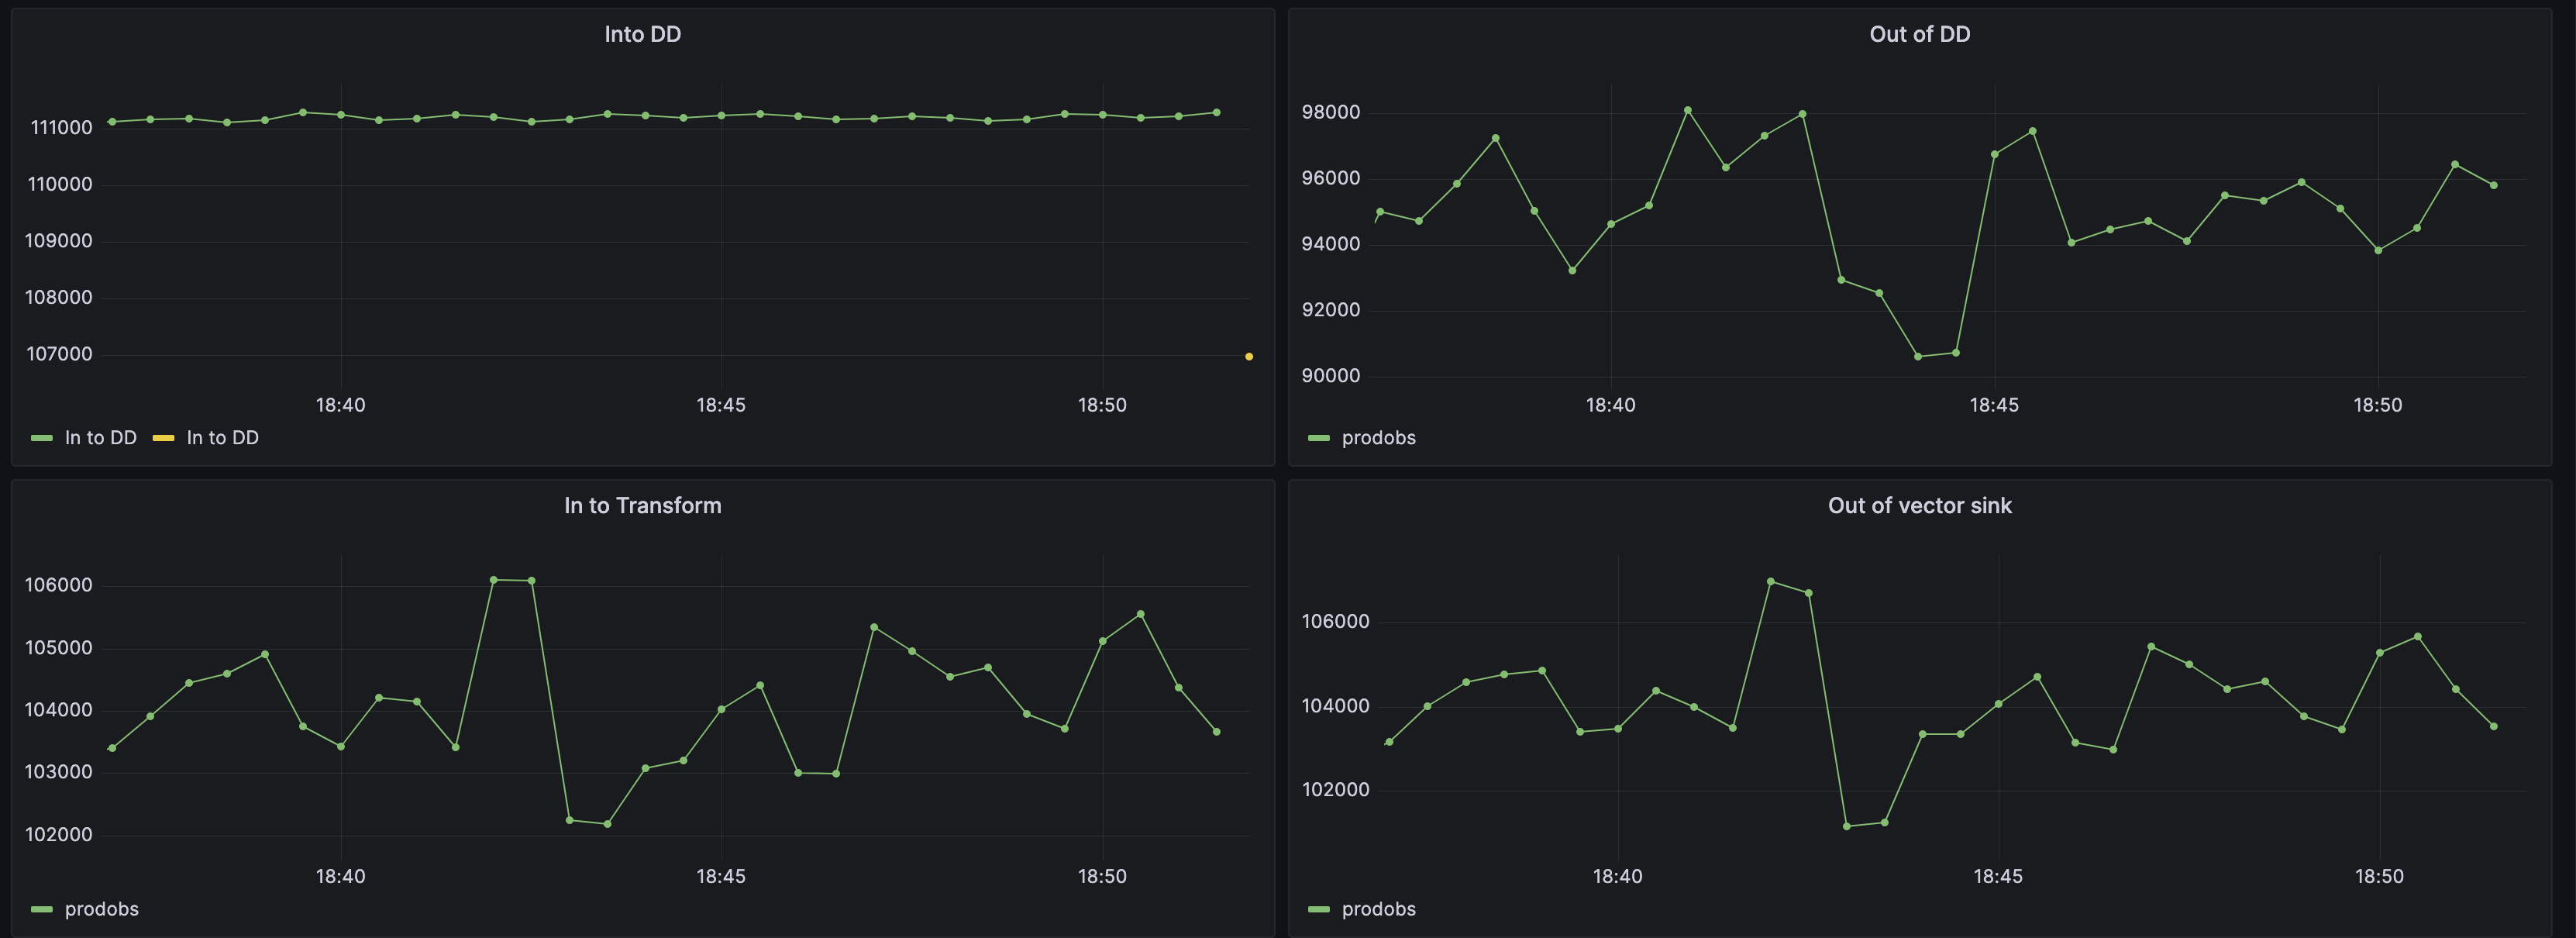
Hey there, We are facing a weird issue where the metric events going into DD agent source is not matching the events going out. Please see the screenshot - Shows the rate of events per second going into a vector agent pod running in K8s cluster
Moreover, we have a transform that has only DD agent source as input and still the events coming in is more than event out of DD agent source.
Are the metrics not working right? What could be causing this ?
Configuration
customConfig:
          data_dir: /data/vector
          api:
            enabled: true
            address: 0.0.0.0:8686
            playground: false
          sources:
            datadog_agent:
              address: 0.0.0.0:8282
              type: datadog_agent
              disable_logs: true
              disable_traces: true
              multiple_outputs: false
            pods:
              type: kubernetes_logs
          transforms:
            modify_tags_for_veneur_metrics:
              type: remap
              inputs:
                - datadog_agent
              source: |-
                .tags.cluster_name = "prodobs"
            filter_for_vector_sink:
              type: filter
              inputs:
                - modify_tags_for_veneur_metrics
              condition:
                type: vrl
                source: |-
                  true
          sinks:
            vector_monitoring_sink:
              type: vector
              acknowledgements:
                enabled: false
              inputs:
                - filter_for_vector_sink
              address: metrics-ingest.segment.local:9000
              compression: true
              batch:
                max_events: 250
Version
0.25.0
Debug Output
No response
Example Data
No response
Additional Context
No response
References
No response
About this issue
- Original URL
- State: closed
- Created a year ago
- Reactions: 2
- Comments: 17 (8 by maintainers)
Ignore the close. That is just a typo. If you look at the expression, it’s already filtered by cluster_name. So practically adding “by cluster_name” doesn’t give anything different.
@neuronull The expressions provided are for In to DD and Out of DD. The issues happens only at high metric volume. We observed the issue only when it crosses about 10000 events per second. For lower volumes, all the graphs match exactly.