traefik: Traefik.docker.network doesn't work with 2 bridge networks on docker-compose
Do you want to request a feature or report a bug?
Bug
What did you do?
Hi, I want to be able to create two different networks on traefik with docker-compose. The first one is frontend where I want to serve the client request and at the same time make another one to use as internal communication but excluding traefik. So some of my dockers are in both networks ( ex: grafana ) and some only in the frontend network. But no matter what I do, I always see on traefik’s status the dockers using both network randomly as if traefik.docker.network was not working.
What did you expect to see?
All the docker on the backends with the same label traefik.docker.network:gestio_frontend on the same network.
What did you see instead?
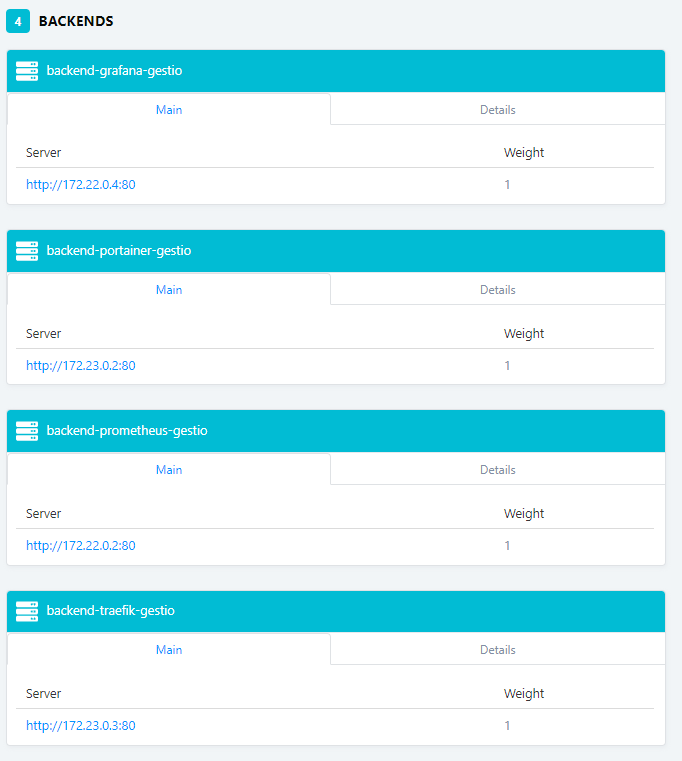
Randomly assigned networks on backends:

Output of traefik version: (What version of Traefik are you using?)
jlorenzo@docker01:~/gestio$ sudo docker run traefik version
Version:      v1.7.5
Codename:     maroilles
Go version:   go1.11.2
Built:        2018-12-03_11:01:00AM
OS/Arch:      linux/amd64
What is your environment & configuration (arguments, toml, provider, platform, …)?
Docker-compose bin
jlorenzo@docker01:~/gestio$ sudo docker-compose version
docker-compose version 1.23.1, build b02f1306
docker-py version: 3.5.0
CPython version: 3.6.7
OpenSSL version: OpenSSL 1.1.0f  25 May 2017
Docker
jlorenzo@docker01:~/gestio$ sudo docker --version
Docker version 18.09.0, build 4d60db4
SO Ubuntu 18
jlorenzo@docker01:~/gestio$ uname -a
Linux docker01 4.15.0-42-generic #45-Ubuntu SMP Thu Nov 15 19:32:57 UTC 2018 x86_64 x86_64 x86_64 GNU/Linux
traefik.toml
defaultEntryPoints = ["http"]

[entryPoints]
  [entryPoints.http]
  address = ":80"

[docker]
endpoint = "unix:///var/run/docker.sock"
domain = "docker.localhost"
exposedByDefault = false
docker-compose.yml
version: "3.7"
networks:
  backend:
    driver: bridge
  frontend:
    driver: bridge
volumes:
  portainer_data:
  grafana_data:
services:
  influxdb:
    labels:
      - "traefik.enable=false"
      - "traefik.frontend.rule=Host:influxdb.test.local;"
    image: influxdb
    volumes:
      - /var/lib/docker/influxdb:/var/lib/influxdb
    networks:
      - backend
  cadvisor:
    labels:
      - "traefik.enable=false"
      - "traefik.frontend.rule=Host:cadvisor.test.local;"
    image: google/cadvisor
    volumes:
      - /:/rootfs:ro #
      - /var/run:/var/run:ro
      - /sys:/sys:ro
      - /var/lib/docker/:/var/lib/docker:ro
    networks:
      - backend
      - frontend
    command: -storage_driver=influxdb -storage_driver_db=cadvisor_db -storage_driver_user=xxxxxxx -storage_driver_password=xxxxxx -storage_driver_host=influxdb:8086
    depends_on:
      - influxdb
  prometheus:
    labels:
      - "traefik.enable=true"
      - "traefik.docker.network:gestio_frontend"
      - "traefik.port=80"
      - "traefik.frontend.rule=Host:prometheus.test.local"
    image: prom/prometheus
    networks:
      - backend
    volumes:
      - /home/user/gestio/prometheus.yml:/etc/prometheus.yml
  grafana:
    labels:
      - "traefik.enable=true"
      - "traefik.docker.network:gestio_frontend"
      - "traefik.port=80"
      - "traefik.frontend.rule=Host:monitor.test.local;"
    image: grafana/grafana
    environment:
      - GF_SECURITY_ADMIN_PASSWORD=XXXXX
    volumes:
      - grafana_data:/var/lib/grafana
    networks:
      - backend
      - frontend
  portainer:
    labels:
      - "traefik.enable=true"
      - "traefik.docker.network:gestio_frontend"
      - "traefik.port=80"
      - "traefik.frontend.rule=Host:orquestrador.test.local;"
    image: portainer/portainer
    volumes:
      - /var/run/docker.sock:/var/run/docker.sock
      - portainer_data:/data
    networks:
      - frontend
  traefik:
    image: traefik  # Imatge oficial de traefik
    command: --api --docker --web --web.metrics.prometheus --web.metrics.prometheus.buckets="0.1,0.3,1.2,5.0" logLevel=DEBUG
    ports:
      - "80:80"
      - "443:443"
      - "8080:8080"
    networks:
      - frontend
    volumes:
      - /var/run/docker.sock:/var/run/docker.sock
      - /home/user/signasuite/traefik.toml:/etc/traefik/traefik.toml  docker
Docker’s Networks
jlorenzo@docker01:~/gestio$ sudo docker network ls
NETWORK ID          NAME                DRIVER              SCOPE
d6521d3d44c7        bridge              bridge              local
43686b370425        gestio_backend      bridge              local
288f68d62f2b        gestio_frontend     bridge              local
25475bc387ea        host                host                local
60b8fd783dfd        none                null                local
And the docker are on both network with inspect and the tag seems configured:
jlorenzo@docker01:~/gestio$ sudo docker inspect 05788279801f | grep -i network
            "NetworkMode": "gestio_backend",
                "traefik.docker.network:gestio_frontend": "",
        "NetworkSettings": {
            "Networks": {
                    "NetworkID": "43686b3704251e79f52164a78b177e76dc92efd332afdbf0ee41d29b0c3180a1",
                    "NetworkID": "288f68d62f2b9ff17b5a428717b49b694f32a3074d752390cb28c9dd4adc071a",
I tried to use “default” and if I set the traefik on both networks then the reverse proxy works (as traefik sees both network and can route the request to backend) but I want the second one out of traefik network.
About this issue
- Original URL
- State: closed
- Created 6 years ago
- Reactions: 4
- Comments: 24 (1 by maintainers)
@RealKanashi, I have the same problem, I don’t use swarm but just docker-compose on developper desk, the fact I had two stack is no different since I declare that some networks are “external”. On this machine, I have other containers launched by docker-compose (for simplicity for the users) that define the traefik_web as external and traefik is able to redirect to them without problem. In the example I provided there is two way to make it functionnal:
But I would prefer that traefik use the “traefik_web” network as defined by the trafik.docker.network label.
@marema31 I’m only a little bit familiar with the code of the v2 (and not the v1.7), so maybe this is not relevant to your problem, but while trying to understand that issue, I noticed this part of the code which might shed some light:
https://github.com/containous/traefik/blob/v2.0/pkg/provider/docker/config.go#L236-L246
i.e. it seems to me that, for a given container, if a network foo is not declared in its “networks” section, and if one tries to use that foo network in a network label (“traefik.docker.network=foo”), then that label is ignored. Does that correspond to the behaviour you’re experiencing?
in other words, are you seeing a log message such as: “Could not find network named ‘%s’ for container ‘%s’! Maybe you’re missing the project’s prefix in the label? Defaulting to first available network.” ? (again, maybe this log message is only in the v2, I haven’t checked the v1.7 code).