traefik: Traefik killed by OOM killer in Kubernetes
Do you want to request a feature or report a bug?
Bug
What did you do?
- Running Traefik as Deployment (ingress controller) in K8s
- Having bunch of Services targeting no Pods (thus having no related Endpoints object)
- Our setup is specific in way that we downscale tens of deployments to 0 on some schedule to not waste resources of K8s cluster.
What did you expect to see?
- Traefik to work and reply with error when tried to access such a service
What did you see instead?
- Traefik leaking memory and eventually being killed by OOM killer
Output of traefik version: (What version of Traefik are you using?)
1.7.4
What is your environment & configuration (arguments, toml, provider, platform, …)?
    defaultEntryPoints = ["http","https"]
    [entryPoints]
      [entryPoints.http]
      address = ":80"
      compress = true
        [entryPoints.http.proxyProtocol]
        trustedIPs = ["xxxx"]
      [entryPoints.https]
      address = ":443"
      compress = true
        [entryPoints.https.proxyProtocol]
        trustedIPs = ["xxxx"]
        [entryPoints.https.tls]
        minVersion = "VersionTLS11"
        cipherSuites = [
          "TLS_ECDHE_RSA_WITH_AES_128_GCM_SHA256",
          "TLS_ECDHE_RSA_WITH_CHACHA20_POLY1305",
          "TLS_ECDHE_RSA_WITH_AES_128_CBC_SHA",
          "TLS_ECDHE_RSA_WITH_AES_256_CBC_SHA",
          "TLS_ECDHE_ECDSA_WITH_AES_128_CBC_SHA",
          "TLS_ECDHE_ECDSA_WITH_AES_256_CBC_SHA"
        ]
    [respondingTimeouts]
      idleTimeout = "900s"
    [lifeCycle]
      requestAcceptGraceTimeout = "10s"
      graceTimeOut = "10s"
    [api]
    [rest]
    [kubernetes]
    [kubernetes.ingressEndpoint]
      hostname = "xxxx.xxxx"
    [metrics]
      [metrics.prometheus]
    [accessLog]
Logs
time="2018-11-28T11:44:33Z" level=warning msg="Endpoints not available for xxx"
time="2018-11-28T11:44:33Z" level=warning msg="Endpoints not available for xxx"
time="2018-11-28T11:44:33Z" level=warning msg="Endpoints not available for xxx"
Tons of those ^
I suspect it being a memory leak in watcher watching the Services/Endpoints as this memory growth is specific just in this case, on our other clusters where we don’t downscale Deployments like this Traefik works just fine.
About this issue
- Original URL
- State: closed
- Created 6 years ago
- Comments: 16 (13 by maintainers)
Thanks, sure will try to.
I think it is quite apparent from our Grafana boards. Bottom graph is go_memstats_* and top one is process_*_memory_bytes Cluster with the leakage: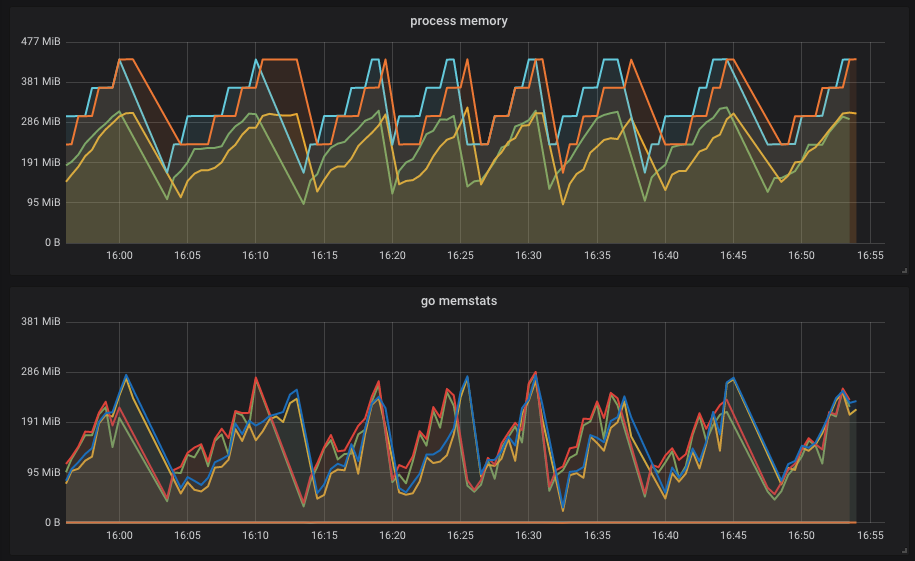 Normal operation:
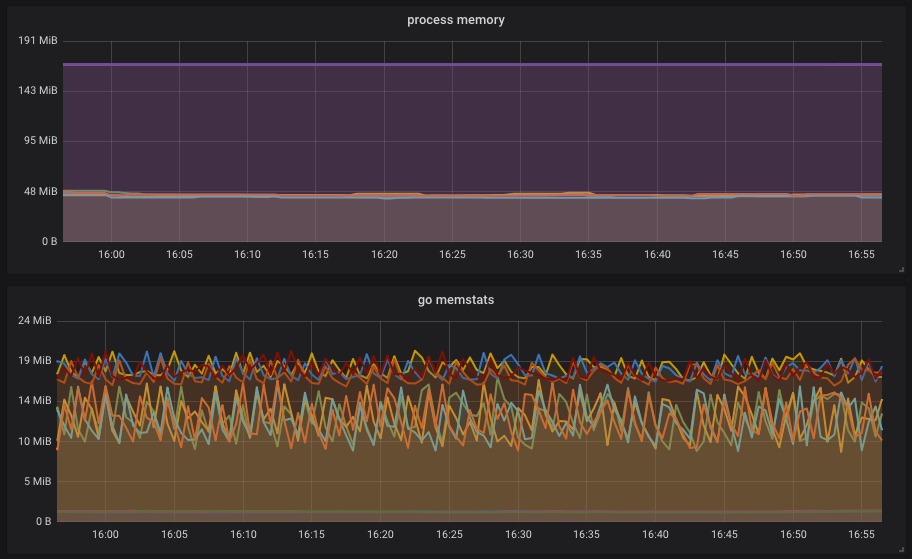 I think it is clear it consumes way less memory, each peak on first screenshot means the Pod was killed by OOM as it hit the cgroups limit.
Deployment:
Pod:
The scheduler logs are not of much help as the cluster is quite busy, and the pods are not rescheduled (just restarted) as it is apparent from
Warning BackOff 2m31s (x8619 over 15d) kubelet, xxx Back-off restarting failed container. What metrics do you want me to provide? Dump of prometheus endpoint?OFC
Ingresses: 340 Services: 451 (All ClusterIPs) Endpoints: 451
What might be of interest is the number of services without the Endpoints (it changes over time with more over out-of-business-hours).
MissingEndpoints: 200 on average up to 451 (Num of Services actually)