traefik: Memory usage keeps growing and continuously slow growing
Do you want to request a feature or report a bug?
Only my question
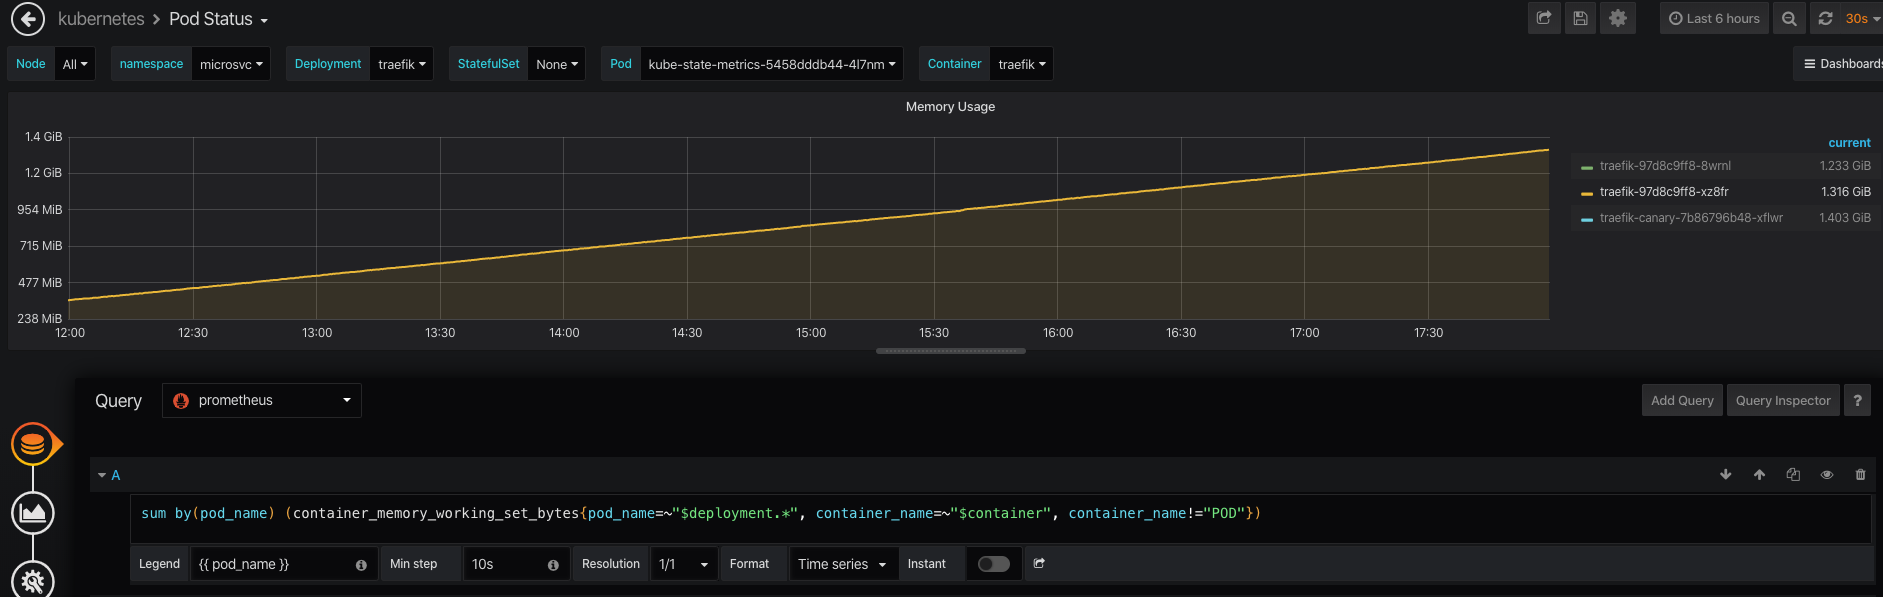
When I used traefik, I found the memory usage keeps growing, continuously slow growing

. So I use Jmeter for pressure test(traefik memeory is limited 2G),the result is:

And then I have stoped it, the memory also keep at 2G, it looks like strange.
Output of traefik version: (What version of Traefik are you using?)
image: traefik:v2.1.0-rc2
What did you do?
My deployment:
apiVersion: extensions/v1beta1
kind: Deployment
metadata:
  labels:
    app: traefik-canary
  name: traefik-canary
  namespace: microsvc
spec:
  progressDeadlineSeconds: 600
  replicas: 1
  revisionHistoryLimit: 10
  selector:
    matchLabels:
      app: traefik-canary
  strategy:
    rollingUpdate:
      maxSurge: 25%
      maxUnavailable: 25%
    type: RollingUpdate
  template:
    metadata:
      creationTimestamp: null
      labels:
        app: traefik-canary
        date: "1573641385"
        name: traefik-canary
    spec:
      serviceAccountName: traefik-ingress-controller
      containers:
      - args:
        - --configFile=/config/traefik-static.yaml
        image: traefik:v2.1.0-rc2
        imagePullPolicy: IfNotPresent
        name: traefik
        ports:
        - containerPort: 80
          name: api
          protocol: TCP
        - containerPort: 8080
          name: admin
          protocol: TCP
        - containerPort: 8090
          name: open
          protocol: TCP
        resources: {}
        terminationMessagePath: /dev/termination-log
        terminationMessagePolicy: File
        resources:
          limits:
            cpu: "2"
            memory: 2Gi
          requests:
            cpu: 100m
            memory: 1Gi
        volumeMounts:
        - mountPath: /config
          name: config-volume
      dnsPolicy: ClusterFirst
      restartPolicy: Always
      schedulerName: default-scheduler
      securityContext: {}
      terminationGracePeriodSeconds: 30
      volumes:
      - configMap:
          defaultMode: 420
          name: traefik
        name: config-volume
And my configMap:
apiVersion: v1
data:
  traefik-static.yaml: |
    entryPoints:
      api:
        address: ":80"
        transport:
          respondingTimeouts:
            readTimeout: 15
            writeTimeout: 15
      open:
        address: ":8090"
        forwardedHeaders:
          insecure: true
        transport:
          respondingTimeouts:
            readTimeout: 15
            writeTimeout: 15
    api:
      dashboard: true
      insecure: true
    providers:
      file:
        directory: /config
        watch: true
      kubernetesCRD: {}
    tracing:
      jaeger:
        collector:
          endpoint: http://jaeger-collector.arch.svc.cluster.local:14268/api/traces
        samplingType: probabilistic
        samplingParam: 0.3
    accessLog:
      filePath: "/log/traefik.log"
      format: json
      bufferingSize: 200
      fields:
        defaultMode: keep
        headers:
          defaultMode: keep
    metrics:
      prometheus: {}
    ping:
      entryPoint: "traefik"

  health-check.yaml: |
    http:
      routers:
        health-check:
          rule: "Path(`/ping`)"
          entryPoints:
          - api
          - open
          service: health-check
      services:
        health-check:
          loadBalancer:
            servers:
            - url: http://localhost:8080/ping

kind: ConfigMap
metadata:
  name: traefik
  namespace: microsvc
About this issue
- Original URL
- State: closed
- Created 5 years ago
- Reactions: 1
- Comments: 22 (10 by maintainers)
How to access debug endpoints. I add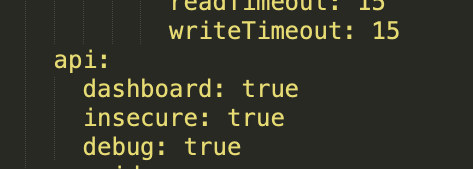
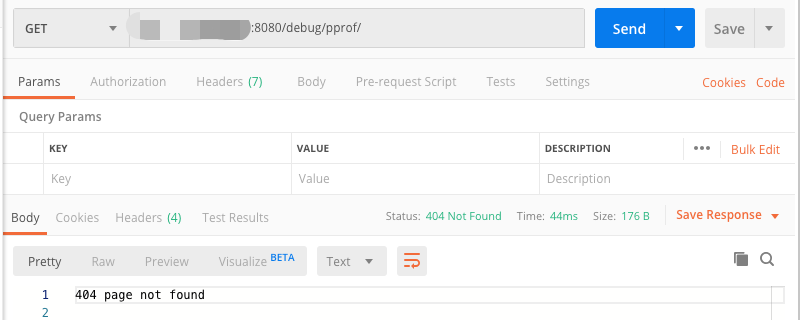
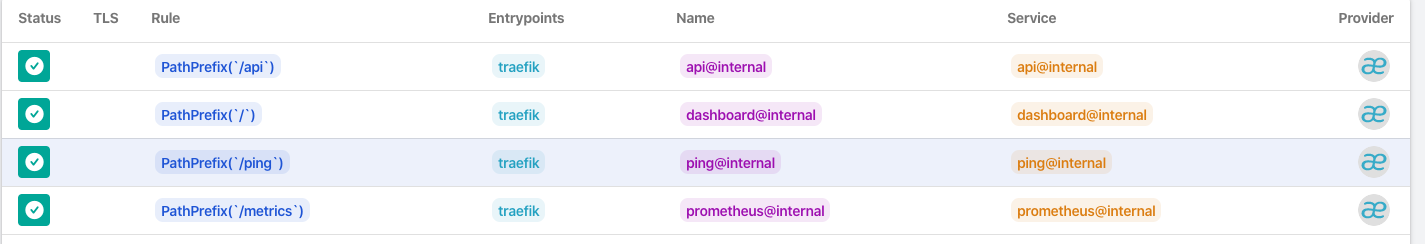
api=debugto my config, but I can’t access.I take your advice: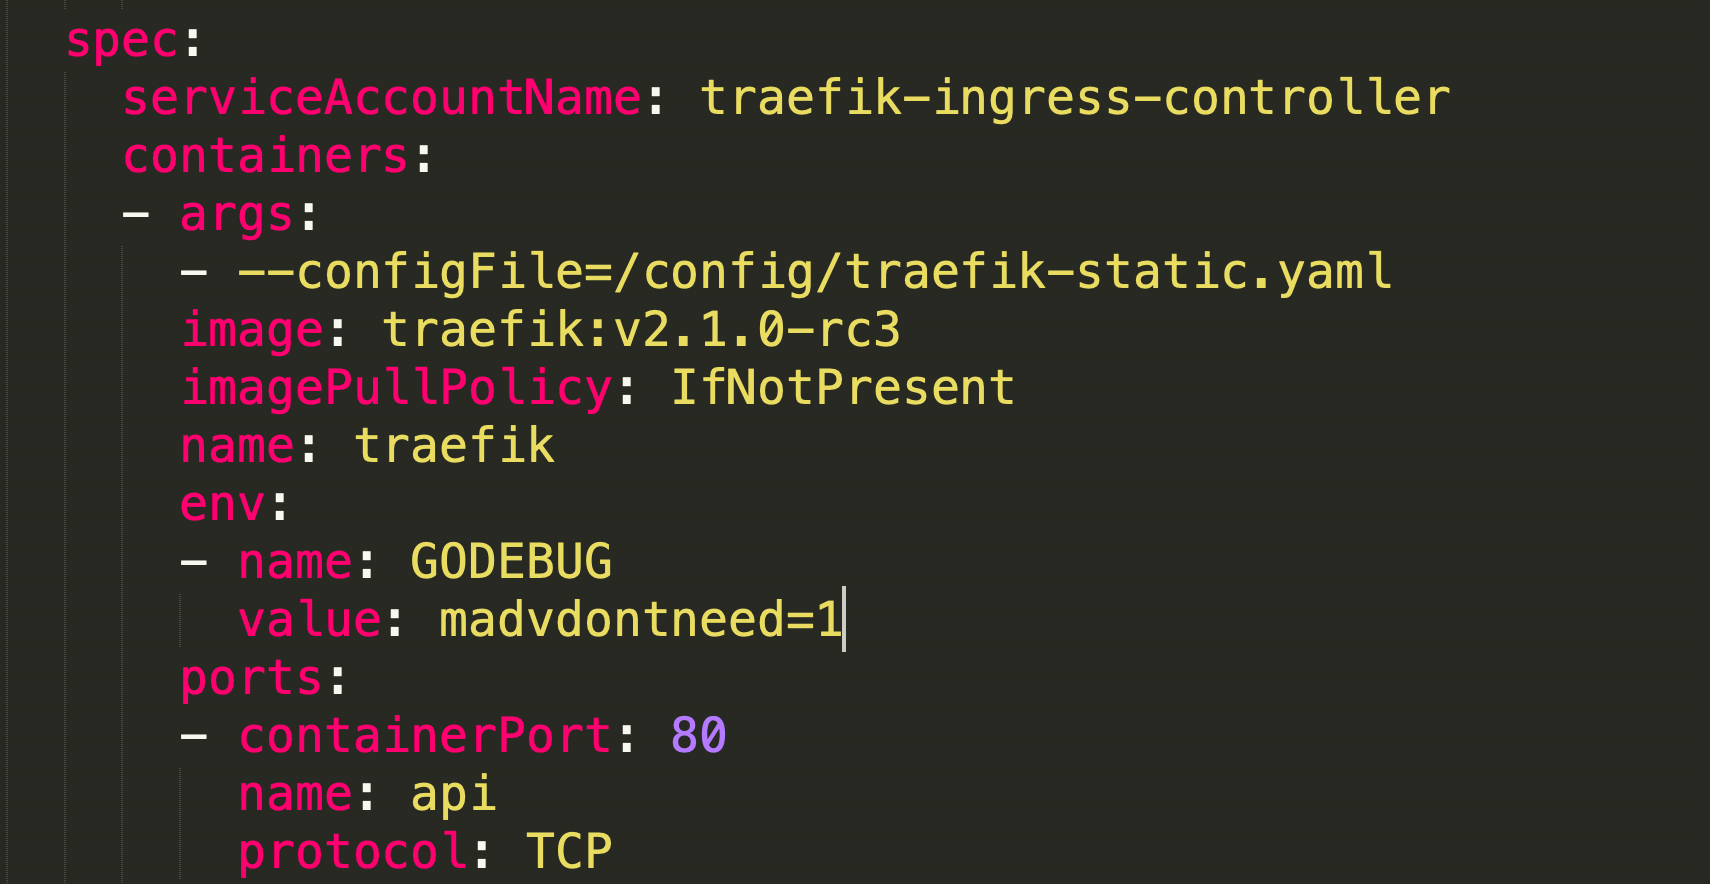 but it doesn’t work(in last 3 hours):
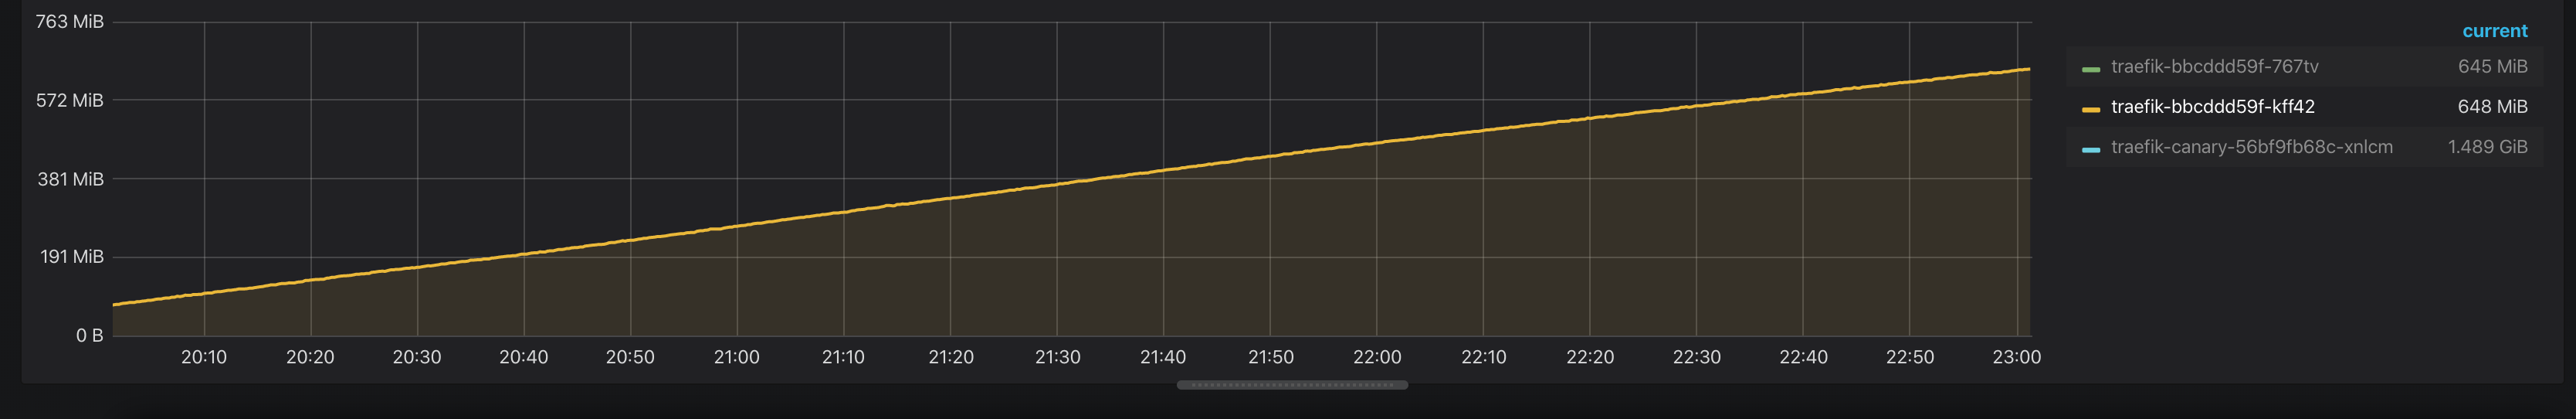
The result is the same, in last 6 hours: