tensorflow: Training suddenly freezes
System information
- Have I written custom code (as opposed to using a stock example script provided in TensorFlow): Yes
- OS Platform and Distribution (e.g., Linux Ubuntu 16.04): Windows
- Mobile device (e.g. iPhone 8, Pixel 2, Samsung Galaxy) if the issue happens on mobile device: No
- TensorFlow installed from (source or binary): binary
- TensorFlow version (use command below): unknown 2.0.0 (see below)
tensorboard=2.0.0=pyhb38c66f_1 tensorflow=2.0.0=gpu_py37h57d29ca_0 tensorflow-base=2.0.0=gpu_py37h390e234_0 tensorflow-estimator=2.0.0=pyh2649769_0 tensorflow-gpu=2.0.0=h0d30ee6_0 tensorflow-probability=0.8.0=py_0
- Python version: Python 3.7.6 (Anaconda)
- Bazel version (if compiling from source):
- GCC/Compiler version (if compiling from source):
- CUDA/cuDNN version: cudatoolkit=10.0.130=0 / cudnn=7.6.4=cuda10.0_0
- GPU model and memory: Nvidia GeForce RTX 2070 8GB
Describe the current behavior
Training a CNN using tf.keras.Model.fit() and tensorflow’s data pipeline with tfrecord files randomly seems to freeze/stop/hang. Whenever this happens, the console process stays open but the CPU/GPU will return to 0% utilization. Using verbose=1 as well as tensorboard also shows that no progress is being made anymore.
Waiting for a while does not help. However, if I restart the training without rebooting my PC, the hang is much more likely to occur again.
Looking into Process explorer, I can see that there is only one really active thread:
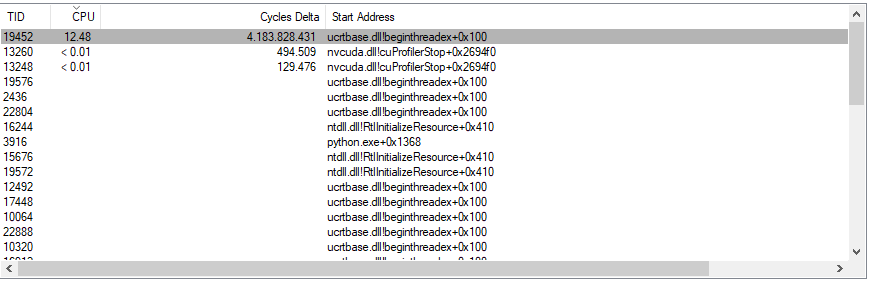
A Callstack for the thread is attached below. The upper few frames (nvcuda.dll!cuProfilerStop) change when refreshing but the rest of the frame stays constant.
Describe the expected behavior The training should continue normally.
Code to reproduce the issue
Since I was not able to reproduce the problem reliably, I have no idea which part of my code might actually be important, The data pipeline uses dataset.map() with num_parallel_calls = tf.data.experimental.AUTOTUNE for multiprocessing and contains two tf.np_function()s (after which I have to use tf.ensure_shape to recover the correct shape for the data).
Other info / logs
nvcuda.dll!cuProfilerStop+0x226617
nvcuda.dll!cuProfilerStop+0x17243c
nvcuda.dll+0x4bbbe
nvcuda.dll+0x10c29d
nvcuda.dll!cuProfilerStop+0x5cc42
nvcuda.dll!cuProfilerStop+0x5da20
nvcuda.dll+0x10bbf0
nvcuda.dll+0x10be3c
nvcuda.dll+0xeac0
nvcuda.dll!cuCtxSynchronize+0x1c2
_pywrap_tensorflow_internal.pyd!std::unique_ptr<tensorflow::Status::State,std::default_delete<tensorflow::Status::State> >::~unique_ptr<tensorflow::Status::State,std::default_delete<tensorflow::Status::State> >+0x10b4f
_pywrap_tensorflow_internal.pyd!tensorflow::Env::NowSeconds+0xd16
_pywrap_tensorflow_internal.pyd!tensorflow::AllocationRecord::Clear+0x550c
_pywrap_tensorflow_internal.pyd!google::protobuf::RepeatedPtrField<tensorflow::InterconnectLink>::Add+0x8f0c
_pywrap_tensorflow_internal.pyd!std::vector<tensorflow::DtypeAndPartialTensorShape,std::allocator<tensorflow::DtypeAndPartialTensorShape> >::operator=+0x623
_pywrap_tensorflow_internal.pyd!TFE_TensorHandleResolve+0x227
_pywrap_tensorflow_internal.pyd!tensorflow::DataTypeSet::Contains+0x2350
_pywrap_tensorflow_internal.pyd!std::vector<tensorflow::monitoring::Point::Label,std::allocator<tensorflow::monitoring::Point::Label> >::reserve+0x85a
python37.dll!PyMethodDef_RawFastCallKeywords+0x387
python37.dll!PyMethodDef_RawFastCallKeywords+0xa5c
python37.dll!PyEval_EvalFrameDefault+0x403
python37.dll!PyFunction_FastCallDict+0xdd
python37.dll!PyObject_FastCall_Prepend+0x6c
python37.dll!PySet_Contains+0x50d
python37.dll!PyErr_NoMemory+0x24eaf
python37.dll!PyEval_SliceIndex+0x42
python37.dll!PySlice_Unpack+0x9d
_multiarray_umath.cp37-win_amd64.pyd+0xc117e
_multiarray_umath.cp37-win_amd64.pyd+0xc0093
python37.dll!PyEval_EvalFrameDefault+0x7e4
python37.dll!PyEval_EvalCodeWithName+0x1a6
python37.dll!PyFunction_FastCallDict+0x1ba
python37.dll!PySlice_New+0x23d
python37.dll!PyEval_EvalFrameDefault+0x1174
python37.dll!PyEval_EvalCodeWithName+0x1a6
python37.dll!PyFunction_FastCallDict+0x1ba
python37.dll!PyObject_Call_Prepend+0x6c
python37.dll!PyType_GetDocFromInternalDoc+0x22d
python37.dll!PyObject_Call+0x75
_pywrap_tensorflow_internal.pyd!std::default_delete<tensorflow::kernel_factory::OpKernelRegistrar::PtrOpKernelFactory>::operator()+0x97d
_pywrap_tensorflow_internal.pyd!std::default_delete<tensorflow::kernel_factory::OpKernelRegistrar::PtrOpKernelFactory>::operator()+0x420
_pywrap_tensorflow_internal.pyd!tensorflow::NodeDef::mutable_experimental_debug_info+0xef56
_pywrap_tensorflow_internal.pyd!tensorflow::NodeDef::mutable_experimental_debug_info+0x11f78
_pywrap_tensorflow_internal.pyd!tensorflow::data::DatasetBaseIterator::RecordElement+0x6f
_pywrap_tensorflow_internal.pyd!Eigen::ThreadPoolTempl<tensorflow::thread::EigenEnvironment>::WorkerLoop+0x3f6
_pywrap_tensorflow_internal.pyd!Eigen::ThreadPoolTempl<tensorflow::thread::EigenEnvironment>::WorkerLoop+0x701
_pywrap_tensorflow_internal.pyd!tensorflow::WindowsFileSystem::TranslateName+0x255
_pywrap_tensorflow_internal.pyd!tensorflow::SavedAsset::GetCachedSize+0x2c19
ucrtbase.dll!beginthreadex+0x142
KERNEL32.DLL!BaseThreadInitThunk+0x14
ntdll.dll!RtlUserThreadStart+0x21
About this issue
- Original URL
- State: closed
- Created 7 years ago
- Reactions: 1
- Comments: 15 (5 by maintainers)
@luozhouyang : Do you also use the tensorflow dataset pipline? And if so, do you also use np_function? Maybe we can find a common factor between our cases and draw a conclusion on what might cause the problem.
I met this bug again! The training is suddenly stop, no errors, no exceptions, and no logs. The training step is stop at
783.I use the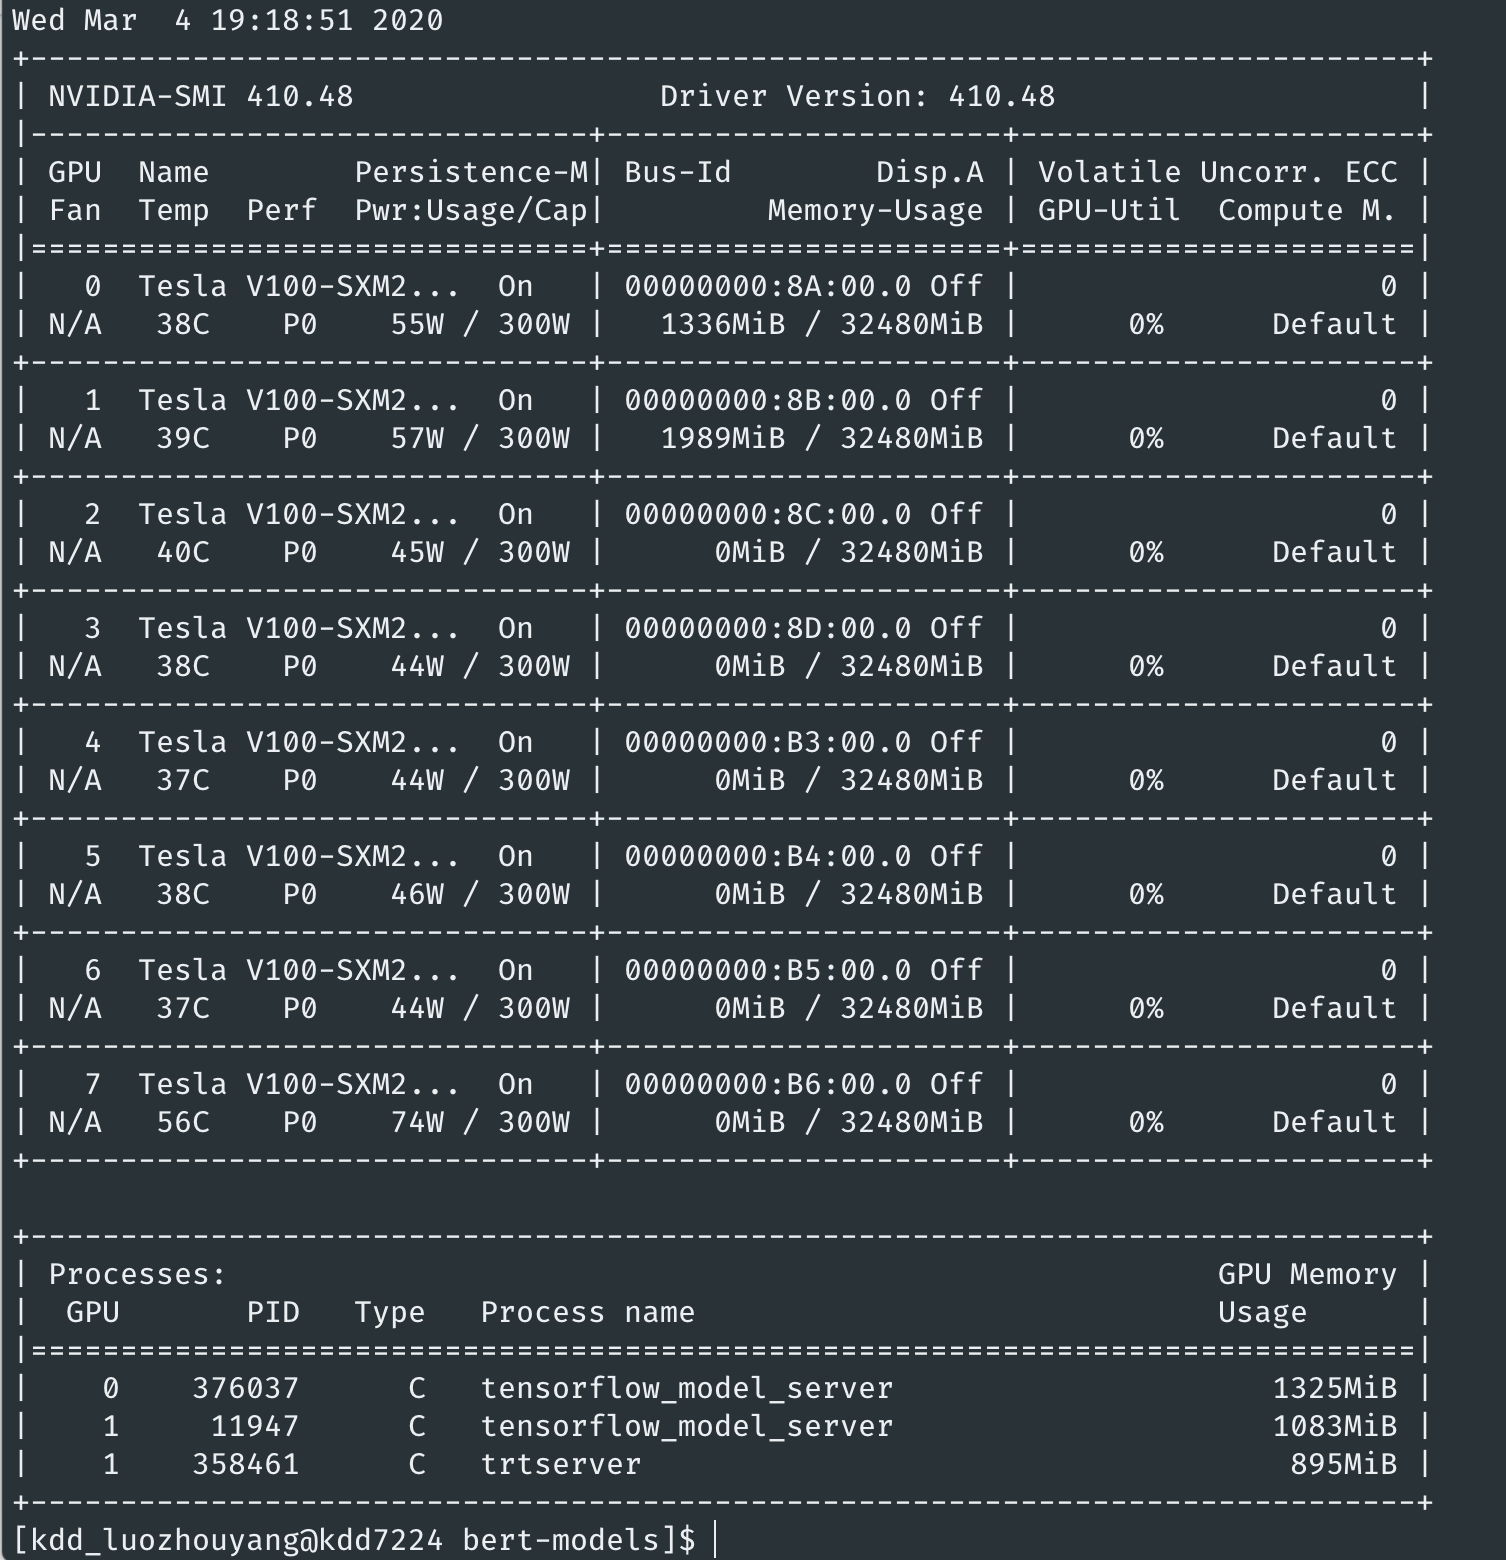
GPU7inside a docker container. Here is the outputs ofnvidia-smi:The process is just exist, no any informations.