tensorflow: Suspected memory leak - when loading multiple models with tf.keras.models.load_model()
Please make sure that this is a bug. As per our GitHub Policy, we only address code/doc bugs, performance issues, feature requests and build/installation issues on GitHub. tag:bug_template
System information
- Have I written custom code (as opposed to using a stock example script provided in TensorFlow): yes
- OS Platform and Distribution (e.g., Linux Ubuntu 16.04): Linux Ubuntu 18.04
- Mobile device (e.g. iPhone 8, Pixel 2, Samsung Galaxy) if the issue happens on mobile device: NA
- TensorFlow installed from (source or binary): binary wheel via PyPI
- TensorFlow version (use command below): 2.1.0-dev20191231 (v1.12.1-21412-g3a094e6 2.1.0-dev20191231)
- Python version:
- Bazel version (if compiling from source): NA
- GCC/Compiler version (if compiling from source): NA
- CUDA/cuDNN version: CUDA 10.0
- GPU model and memory:
V100 32 GB
You can collect some of this information using our environment capture
script
You can also obtain the TensorFlow version with: 1. TF 1.0:
python -c "import tensorflow as tf; print(tf.GIT_VERSION, tf.VERSION)"2. TF 2.0:python -c "import tensorflow as tf; print(tf.version.GIT_VERSION, tf.version.VERSION)"
Describe the current behavior
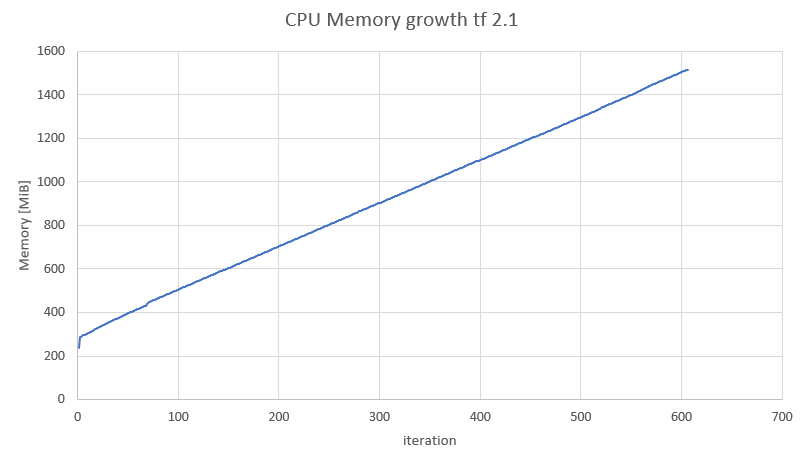
I’m suspecting a CPU memory leak when loading multiple models. When im running infinite loop that keeps loading the same model while using the same variable the memory (private bytes and working set) of the process keep increasing. At some points the working set seems to free some memory, but the trend is that the memory keeps on rising. I used a simple model (attached).
This trend happens even though I call gc.collect() on every iteration and tf.keras.backend.clear_session().
the issue also happens in TF 2.0 (v2.0.0-rc2-26-g64c3d38 2.0.0). for a specific model: running in TF 2.0 each iteration adds 16 MiB running in TF 2.1 each iteration adds 2 MiB
Describe the expected behavior
The memory shouldnt increase on each interation
Code to reproduce the issue `
import os
import tensorflow as tf
import gc # garbage collector
import objgraph
from memory_profiler import profile

def mem_stat():
  objs = gc.get_objects()
  print("total objects count", len(objs))

@profile
def profile_own_model():
    model = tf.keras.models.Sequential([
        tf.keras.layers.Flatten(input_shape=(28, 28)),
        tf.keras.layers.Dense(128, activation='relu'),
        tf.keras.layers.Dropout(0.2),
        tf.keras.layers.Dense(10, activation='softmax')
    ])
    # model.save('my_model')
    tf.keras.backend.clear_session()
    del model
    gc.collect()

@profile
def profile_load_model(path):
    model = tf.keras.models.load_model(model_path, compile=False)
    tf.keras.backend.clear_session()
    del model
    gc.collect()


model_path = f'/my_model.hd5'
print("load model in loops:")

c = 1
while True:
    print("----------- iter", c)
    profile_load_model(model_path)

    print("mem stat after model creation:")
    mem_stat()
    objgraph.show_growth(limit=30)
    c += 1
`
Other info / logs
Include any logs or source code that would be helpful to diagnose the problem. If including tracebacks, please include the full traceback. Large logs and files should be attached.
About this issue
- Original URL
- State: closed
- Created 4 years ago
- Reactions: 2
- Comments: 15 (4 by maintainers)
This seems to be reduced with the latest tf-nightly, tested with this colab notebook.
See also #40171 for more discussion.
Closing as stale. Please reopen if you’d like to work on this further.
@gadagashwini hi I looked at the gist, it looks like the profiler can’t work under Ipython environment, you can look at the memory with your own tools. to run the code just comment the memory_profiler part:
`