pipeline: Too much tekton metrics which makes our monitoring system doesn't work well
Expected Behavior
Just have some high level scope metric collecting, so that admin can know the whole tekton overview in my monitoring system. Or allow end user to choose which metric we want to collect.
Actual Behavior
Currently, each metric is very fine-grained that have multiple labels: https://github.com/tektoncd/pipeline/blob/master/docs/metrics.md
pipeline=<pipeline_name>
pipelinerun=<pipelinerun_name>
status=<status>
task=<task_name>
taskrun=<taskrun_name>
namespace=<pipelineruns-taskruns-namespace>
And tekton pipeline also have Histogram type, which include lots of data like:
tekton_taskrun_duration_seconds_bucket{namespace="2213a7c1-a282",status="failed",task="anonymous",taskrun="perf-br-test-10-fwmbg",le="10"} 0
tekton_taskrun_duration_seconds_bucket{namespace="2213a7c1-a282",status="failed",task="anonymous",taskrun="perf-br-test-10-fwmbg",le="30"} 0
tekton_taskrun_duration_seconds_bucket{namespace="2213a7c1-a282",status="failed",task="anonymous",taskrun="perf-br-test-10-fwmbg",le="60"} 0
tekton_taskrun_duration_seconds_bucket{namespace="2213a7c1-a282",status="failed",task="anonymous",taskrun="perf-br-test-10-fwmbg",le="300"} 1
tekton_taskrun_duration_seconds_bucket{namespace="2213a7c1-a282",status="failed",task="anonymous",taskrun="perf-br-test-10-fwmbg",le="900"} 1
tekton_taskrun_duration_seconds_bucket{namespace="2213a7c1-a282",status="failed",task="anonymous",taskrun="perf-br-test-10-fwmbg",le="1800"} 1
tekton_taskrun_duration_seconds_bucket{namespace="2213a7c1-a282",status="failed",task="anonymous",taskrun="perf-br-test-10-fwmbg",le="3600"} 1
tekton_taskrun_duration_seconds_bucket{namespace="2213a7c1-a282",status="failed",task="anonymous",taskrun="perf-br-test-10-fwmbg",le="5400"} 1
tekton_taskrun_duration_seconds_bucket{namespace="2213a7c1-a282",status="failed",task="anonymous",taskrun="perf-br-test-10-fwmbg",le="10800"} 1
tekton_taskrun_duration_seconds_bucket{namespace="2213a7c1-a282",status="failed",task="anonymous",taskrun="perf-br-test-10-fwmbg",le="21600"} 1
tekton_taskrun_duration_seconds_bucket{namespace="2213a7c1-a282",status="failed",task="anonymous",taskrun="perf-br-test-10-fwmbg",le="43200"} 1
tekton_taskrun_duration_seconds_bucket{namespace="2213a7c1-a282",status="failed",task="anonymous",taskrun="perf-br-test-10-fwmbg",le="86400"} 1
tekton_taskrun_duration_seconds_bucket{namespace="2213a7c1-a282",status="failed",task="anonymous",taskrun="perf-br-test-10-fwmbg",le="+Inf"} 1
tekton_taskrun_duration_seconds_sum{namespace="2213a7c1-a282",status="failed",task="anonymous",taskrun="perf-br-test-10-fwmbg"} 75
tekton_taskrun_duration_seconds_count{namespace="2213a7c1-a282",status="failed",task="anonymous",taskrun="perf-br-test-10-fwmbg"} 1
tekton_taskrun_duration_seconds_bucket{namespace="2213a7c1-a282",status="success",task="anonymous",taskrun="perf-br-k-1-tw4d4",le="10"} 0
tekton_taskrun_duration_seconds_bucket{namespace="2213a7c1-a282",status="success",task="anonymous",taskrun="perf-br-k-1-tw4d4",le="30"} 0
tekton_taskrun_duration_seconds_bucket{namespace="2213a7c1-a282",status="success",task="anonymous",taskrun="perf-br-k-1-tw4d4",le="60"} 0
tekton_taskrun_duration_seconds_bucket{namespace="2213a7c1-a282",status="success",task="anonymous",taskrun="perf-br-k-1-tw4d4",le="300"} 1
tekton_taskrun_duration_seconds_bucket{namespace="2213a7c1-a282",status="success",task="anonymous",taskrun="perf-br-k-1-tw4d4",le="900"} 1
tekton_taskrun_duration_seconds_bucket{namespace="2213a7c1-a282",status="success",task="anonymous",taskrun="perf-br-k-1-tw4d4",le="1800"} 1
tekton_taskrun_duration_seconds_bucket{namespace="2213a7c1-a282",status="success",task="anonymous",taskrun="perf-br-k-1-tw4d4",le="3600"} 1
tekton_taskrun_duration_seconds_bucket{namespace="2213a7c1-a282",status="success",task="anonymous",taskrun="perf-br-k-1-tw4d4",le="5400"} 1
tekton_taskrun_duration_seconds_bucket{namespace="2213a7c1-a282",status="success",task="anonymous",taskrun="perf-br-k-1-tw4d4",le="10800"} 1
tekton_taskrun_duration_seconds_bucket{namespace="2213a7c1-a282",status="success",task="anonymous",taskrun="perf-br-k-1-tw4d4",le="21600"} 1
tekton_taskrun_duration_seconds_bucket{namespace="2213a7c1-a282",status="success",task="anonymous",taskrun="perf-br-k-1-tw4d4",le="43200"} 1
tekton_taskrun_duration_seconds_bucket{namespace="2213a7c1-a282",status="success",task="anonymous",taskrun="perf-br-k-1-tw4d4",le="86400"} 1
tekton_taskrun_duration_seconds_bucket{namespace="2213a7c1-a282",status="success",task="anonymous",taskrun="perf-br-k-1-tw4d4",le="+Inf"} 1
tekton_taskrun_duration_seconds_sum{namespace="2213a7c1-a282",status="success",task="anonymous",taskrun="perf-br-k-1-tw4d4"} 96
tekton_taskrun_duration_seconds_count{namespace="2213a7c1-a282",status="success",task="anonymous",taskrun="perf-br-k-1-tw4d4"} 1

...

tekton_reconcile_latency_bucket{key="037c84c8-c864/perf-br-05-1bp-1-2sb4x",reconciler="TaskRun",success="true",le="10"} 0
tekton_reconcile_latency_bucket{key="037c84c8-c864/perf-br-05-1bp-1-2sb4x",reconciler="TaskRun",success="true",le="100"} 0
tekton_reconcile_latency_bucket{key="037c84c8-c864/perf-br-05-1bp-1-2sb4x",reconciler="TaskRun",success="true",le="1000"} 1
tekton_reconcile_latency_bucket{key="037c84c8-c864/perf-br-05-1bp-1-2sb4x",reconciler="TaskRun",success="true",le="10000"} 1
tekton_reconcile_latency_bucket{key="037c84c8-c864/perf-br-05-1bp-1-2sb4x",reconciler="TaskRun",success="true",le="30000"} 1
tekton_reconcile_latency_bucket{key="037c84c8-c864/perf-br-05-1bp-1-2sb4x",reconciler="TaskRun",success="true",le="60000"} 1
tekton_reconcile_latency_bucket{key="037c84c8-c864/perf-br-05-1bp-1-2sb4x",reconciler="TaskRun",success="true",le="+Inf"} 1
tekton_reconcile_latency_sum{key="037c84c8-c864/perf-br-05-1bp-1-2sb4x",reconciler="TaskRun",success="true"} 399
tekton_reconcile_latency_count{key="037c84c8-c864/perf-br-05-1bp-1-2sb4x",reconciler="TaskRun",success="true"} 1
tekton_reconcile_latency_bucket{key="037c84c8-c864/perf-br-05-2bp-1-qf9zc",reconciler="TaskRun",success="true",le="10"} 0
tekton_reconcile_latency_bucket{key="037c84c8-c864/perf-br-05-2bp-1-qf9zc",reconciler="TaskRun",success="true",le="100"} 0
tekton_reconcile_latency_bucket{key="037c84c8-c864/perf-br-05-2bp-1-qf9zc",reconciler="TaskRun",success="true",le="1000"} 1
tekton_reconcile_latency_bucket{key="037c84c8-c864/perf-br-05-2bp-1-qf9zc",reconciler="TaskRun",success="true",le="10000"} 1
tekton_reconcile_latency_bucket{key="037c84c8-c864/perf-br-05-2bp-1-qf9zc",reconciler="TaskRun",success="true",le="30000"} 1
tekton_reconcile_latency_bucket{key="037c84c8-c864/perf-br-05-2bp-1-qf9zc",reconciler="TaskRun",success="true",le="60000"} 1
tekton_reconcile_latency_bucket{key="037c84c8-c864/perf-br-05-2bp-1-qf9zc",reconciler="TaskRun",success="true",le="+Inf"} 1
tekton_reconcile_latency_sum{key="037c84c8-c864/perf-br-05-2bp-1-qf9zc",reconciler="TaskRun",success="true"} 458
tekton_reconcile_latency_count{key="037c84c8-c864/perf-br-05-2bp-1-qf9zc",reconciler="TaskRun",success="true"} 1
It mean, each taskrun will all collect metrics: tekton_pipelinerun_duration_seconds_[bucket, sum, count], tekton_pipelinerun_taskrun_duration_seconds_[bucket, sum, count], tekton_taskrun_duration_seconds_[bucket, sum, count], etc…
And each data won’t be removed from metrics after any taskrun is completed or removed.
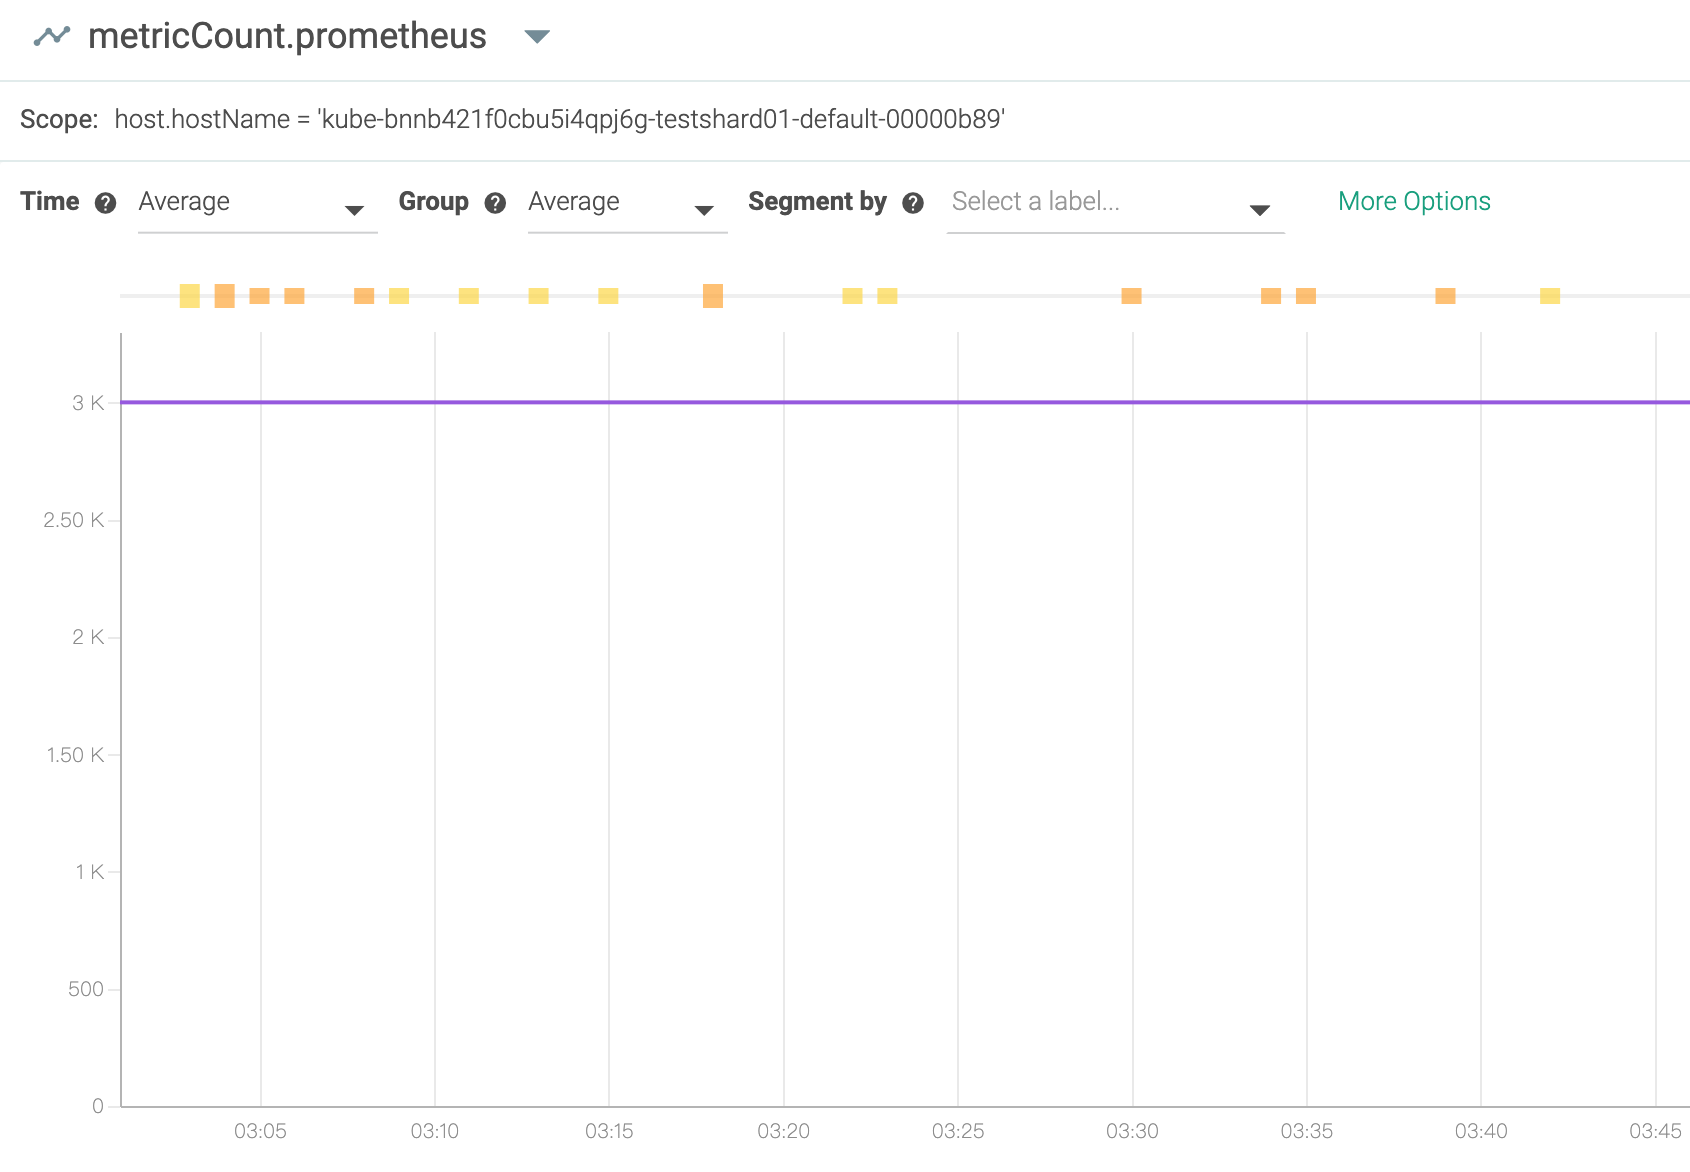
And we are using Prometheus and sysdig, we can only forward 3000 metrics each times (10 seconds), you can find that the info here: https://docs.sysdig.com/en/limit-prometheus-metric-collection.html#UUID-0c740bd2-4666-061b-c224-9694e12e2276_section-idm231791561676295
max_metrics

The maximum number of Prometheus metrics that the agent can consume from the target.
The default is 1000.
The maximum limit is 10,000 on agent v10.0.0 and above.
The maximum limit is 3000 on agent versions below 10.0.0.
if we have more and more tekton taskrun metrics, which will make the metric count full and the other metrics after 3000 will be dropped and we cannot receive other anymore.
Steps to Reproduce the Problem
- Enable the tekton pipeline metrics
- Continue creating some taskrun
- see the metrics from local or sysdig console
- Tekton Pipeline version:
v0.11.3
So I am wondering, do we really need so fine-grained metric for each taskrun? Can we select which metric we want to use?
If we have more and more taskruns be created, more and more metrics will be generated, the monitoring system will be full or slow or crash. I think in the end, on one would like to use this metric, because it is so fine-grained and so much info for a cluster or tekton admin and make other metrics don’t work.
I suggest, it is better that each metric is just for some high level data, for example, the duration seconds for all taskruns, not record for each one.
Thanks!
About this issue
- Original URL
- State: closed
- Created 4 years ago
- Reactions: 3
- Comments: 23 (14 by maintainers)
+1 to a ConfigMap option to only report namespace-level metrics.
I’d love to get more data about how users are using these metrics, since I suspect based on the relative lack of urgency on this issue that people don’t actually depend on the task and taskRun keys, and we can just remove them via feature flag or
config-observabilityoption. I’d prefer not to plan to have the option exist indefinitely, and instead use it to phase out support for fine-grained metrics.In general I think metrics are most useful as a high-level view, and shouldn’t include information about the specific workflow (pipeline name, task name, etc.) – if you want to track the latency of a pipeline execution over time, you can do that by scraping
kubectl get pipelinerunand eventually by querying Tekton Results – and maybe emitting your own metrics based on that aggregation, that’s up to you.So I think my proposal would be to add a feature flag to only report at the namespace level, default it to
falsefor 1+ release, mention this in release notes, and if there’s no significant user pushback default it totruefor 1+ release, then remove it entirely. If there is user pushback, we can use their input to guide future decisions, but my belief is that nobody depends on this today.wdyt?
Hi all that might be interested in, I wrote a TEP https://github.com/tektoncd/community/pull/286 on this issue. It has integrated some thoughts from your comments. Love to hear your feedback!
Hi all,
Our colleague already fixed the same problem in Knative/pkg, and I heard the Tekton also uses the same knati/pkg for metrics.
Can you please help check if it is helpful after update the knative/pkg in Tekton? https://github.com/knative/pkg/pull/1494
Thanks!