sunpy: Unexpected SunPy-rendered RHESSI colormaps
Description
The colormap “rhessi” as in SunPy visualization (blue-green-red) which appears to be the standard matplotlib-jet colormap, is not the same as the “official” mission colormaps, when compare with the ones used on hesperia (black, blue, purple, red, orange, green/yellow, white).
Expected vs Actual behavior
Being able to plot the map with the expected mission colormap.
Steps to Reproduce
from sunpy.io.fits import read
from sunpy.time import parse_time
from sunpy.map import Map

url = "https://hesperia.gsfc.nasa.gov/rhessi_extras/imagecube_fits/2002/07/05/20020705_0801_0815/hsi_imagecube_clean_20020705_0801_14tx2e.fits"
f = read(url)
m = Map(f[0].data[0][0], f[0].header)
m.plot_settings['cmap'] = 'rhessi'
m.plot()
System Details
- SunPy Version: 2.0
- Astropy Version: 4.0
- Python Version: 3.7.3
- OS information: Win10
About this issue
- Original URL
- State: closed
- Created 4 years ago
- Reactions: 1
- Comments: 35 (11 by maintainers)
I’ve made the PR @Laubeee if you want to have a look over it #4665
@hayesla In my case I’d be happy to be able to use the STD GAMMA-II as well, but HESSI could be assigned as default colormap for the RHESSIMap?
Go right ahead.
thanks both
I suggest to use the names Albert used, resp. GSFC uses, so I suggest
std_gamma_II,hessiandhessi_black_white(if the last one even makes sense to include? I don’t think it’s really used in practice…)I have no “hard” preference. You could take this one here, then I can focus on opening another PR I wanted to open for some time in sunkit-instruments 😃
I will let you take over this issue @nabobalis Thanks!
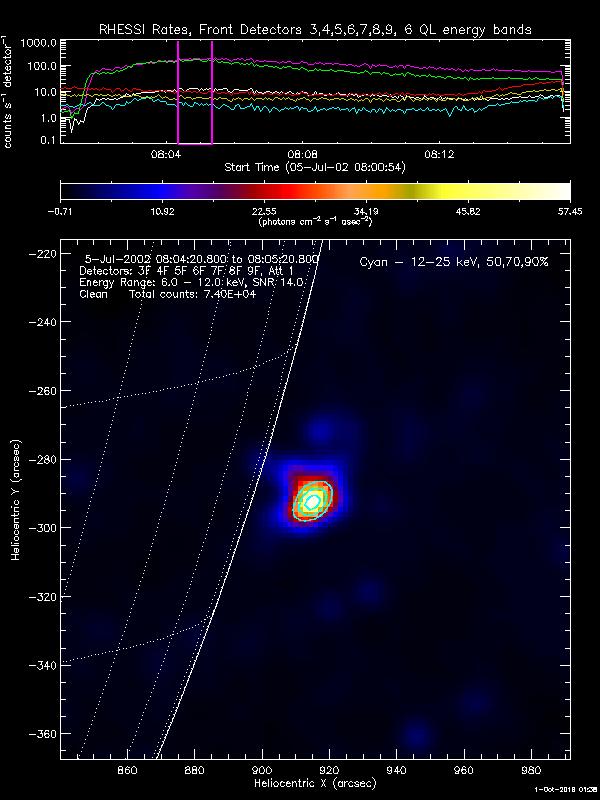
RHESSI does have a “mission” colormap; for example, it’s what’s used for the quicklook images in the RHESSI Browser. However, the HESSI color table is actually a little more difficult to load than it used to be. This binary file for
loadctcontains it as table 41. The HESSI color table is intended for a range that is symmetric about zero (i.e., black is at the middle of the range), whereas STD GAMMA-II is better for a range that is (mostly) all positive (i.e., black is at the start of the range). Here’s a comparison:HESSI color table
STD GAMMA-II color table
That said,
matplotlib-jetdoesn’t match either of these. It looks like @ehsteve picked that colormap in https://github.com/sunpy/sunpy/commit/07f203a9ad822dbfbb28c49003bc4003427d149a (part of #22) for SunPy 0.2, and it hasn’t been given further consideration since 2011.I dont know if RHESSI has a ‘mission’ colormap per say (maybe @ayshih can comment) - RHESSI map plotted in the archive are usually plotted with
loadct 5in IDL from here (https://www.harrisgeospatial.com/docs/LoadingDefaultColorTables.html) which is “STD GAMMA-II”.If you wanted something close - maybe
cmap=plt.cm.CMRmap?