spinnaker: Same GCB build can trigger many pipeline executions
Issue Summary:
The exact same GCB build can trigger many executions of the same pipeline.
Cloud Provider(s):
GCP
Environment:
Spinnaker 1.16.4. Spinnaker for GCP.
Feature Area:
GCB Triggers / PubSub / Echo
Description:
We have a pipeline configured with two GCB triggers (pointing to different Git repos), so that each successful build will trigger a pipeline execution. However, I’m finding that each successful GCB build will trigger many executions – I’ve seen up to 10 or so queued executions for the same GCB build, at which point I’ve had to disable the pipeline and manually cancel all queued executions.
Steps to Reproduce:
This isn’t reproducible: This pipeline is generated with sponnet, just like two more pipelines that don’t seem affected by this issue so far. Each pipeline is responsible for delivering the same software to different Kubernetes clusters, although those artifacts come from different Git branches and therefore use different GCB triggers. All GCB triggers used by these pipelines share the same GCB account in Spinnaker.
Additional Details:
I confirmed the executions were triggered by the same GCB build by looking at their sources in Gate (https://my-spinnaker.com/gate/pipelines/{pipeline-id}). For example, here you can see the relevant data for two of those executions:
$ jq '{id: .id, git_commit: .trigger.payload.sourceProvenance.resolvedRepoSource.commitSha, gcb_url: .trigger.payload.logUrl }' exec1.json
{
  "id": "01DRH3KH6MAE2THEMGBMG08F5T",
  "git_commit": "1d8b769a26e44abdae5da2a58adc6af012496d7d",
  "gcb_url": "https://console.cloud.google.com/gcr/builds/c7d43830-362b-4467-96ad-543f1147bdda?project=12345"
}

$ jq '{id: .id, git_commit: .trigger.payload.sourceProvenance.resolvedRepoSource.commitSha, gcb_url: .trigger.payload.logUrl }' exec2.json
{
  "id": "01DRH3JRQC204CWDBXRH1D3B2H",
  "git_commit": "1d8b769a26e44abdae5da2a58adc6af012496d7d",
  "gcb_url": "https://console.cloud.google.com/gcr/builds/c7d43830-362b-4467-96ad-543f1147bdda?project=12345"
}
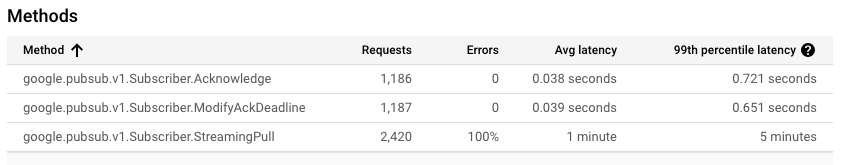
I suspect Spinnaker is failing to acknowledged the PubSub messages on time:
Cloud Pub/Sub guarantees at-least-once message delivery, which means that occasional duplicates are to be expected. However, a high rate of duplicates may indicate that the client is not acknowledging messages within the configured ack_deadline_seconds, and Cloud Pub/Sub is retrying the message delivery. (…) Another possibility is that the subscriber is not acknowledging some messages because the code path processing those specific messages fails, and the Acknowledge call is never made; or the push endpoint never responds or responds with an error.
https://cloud.google.com/pubsub/docs/faq#duplicates
I also had a look at the GCP PubSub metrics and this is what I found (data below is limited to the Spinnaker service account in the past 24 hours):
About this issue
- Original URL
- State: closed
- Created 5 years ago
- Comments: 22 (12 by maintainers)
@bsda : Thanks a lot for digging into this! It looks like the root cause here is that
echois calling the/historyendpoint withlimit=1every time it needs the most recent pipeline definition. That endpoint is pretty inefficient as it grabs the entire history and sorts it.I’ve added a new endpoint in spinnaker/front50#644 that will just get the most recent definition, and will migrate existing usages over to it. That should completely resolve your issue with extremely long calls to
front50.Here is my update with our findings after upgrading the version of spinnaker; We no longer see this issue.
In summary:
Error triggering Pipelinemessage appears just before the update was startedAs such I don’t believe this warrants a seperate issue to be created as it has likely been resolved by the same orca bug that was addressed in the 1.18.x release
Thanks @ezimanyi for the response. We are currently running spinnaker 1.17.5 and plan to update to 1.19.8 next week so will be watching to see if this resolves our issue. There is definately something up with orca because we see the echo -> orca call being made and then echo registers an error in its log:
We also notice that the second attempt to trigger is made in under 20 seconds so I think, but can’t see a log entry confirming this, that orca sends echo a non-200 response even though it does actually trigger a pipeline.
I will post back here with findings after our update before deciding if a new issue is needed
From our point of view the actions suggested fixed our issue and this ticket can be closed.
To answer the question above about whether there is functionality to delete history of a specific pipeline, I don’t believe that there is in Spinnaker. (There is, as you note, a way to delete the history of executions, but as far as I’m aware no way to delete the history of changes to the config itself.)
One solution that might work for you is to enable Object Lifecycle Management on the bucket and configure it to delete objects when there are more than N newer versions. Once the fix I note above has been released, that also should fix this performance issue for you.
@ademariag are you using GCS for front50? I changed my bucket to be regional and deployed spinnaker from scratch. The same pipeline works now fine and a request that was taking more than 20s now is very quick
HTTP 200 http://spin-orca.default:8083/orchestrate (123ms). I don’t know if this might be related with having lots of entries on the pipeline history…@gnarea : I think the part you extracted from your echo logs is indeed the interesting part. It looks like it’s taking
orcalonger than the 20s network timeout to process the call to/orchestratewhich is causing echo to continually re-try it. (This makes me wonder if in fact we should not retry failed POST requests on network failures, as we’d have no way of knowing whether the original request completed or not.)Looking into the orca logs for some more details, it seems like orca is getting a lot of failures on calling out to
front50. I’m wondering if what’s happening is there are a lot of backed up network connections fromorca->front50which is causing theecho->orcaconnections to time out (asorcaneeds to fetch the pipeline fromfront50to serve the/orchestrateendpoint).I think the next step to debug is to figure out why these
/orchestratecalls are taking > 20s to return. Per the above hypothesis, this might involve seeing whetherfront50is overloaded or if there’s something else in that endpoint taking a long time.You might also try as a workaround setting this in your
echo-local.yml:That would increase the timeout on network calls to 2 min, hopefully reducing the number of retries on network failures—but this is really just a workaround as there’s definitely something else going on here if your
/orchestratecalls are routinely taking more than the default 20s.