spire: Verify spire-agent high cpu load caused by k8s JSON parsing
- Version: 1.5.2
- Platform: Linux 5.19.0-35-generic_#36~22.04.1-Ubuntu SMP PREEMPT_DYNAMIC x86_64
- Subsystem: agent
During performance tests we experienced that spire-agents utilize high CPU load while spire-servers hardly utilize CPU.
NAME                CPU(cores)   MEMORY(bytes)
spire-agent-5nlk4   488m         47Mi
spire-agent-c7tpr   634m         51Mi
spire-agent-jgsvr   464m         58Mi
spire-agent-l9zzz   406m         39Mi
spire-agent-mdstq   487m         60Mi
spire-agent-qnpd2   390m         45Mi
spire-agent-r6r94   509m         40Mi
spire-server-0      7m           117Mi
spire-server-1      3m           48Mi
There are 46 registration entries with 1h TTL. There are 4 worker nodes in the system, the maximum limit is 500 pods/worker node. During the test there are ~70 pods running per worker nodes.
Below I copied the agent configuration, which is very simple:
agent {
    data_dir = "/run/spire/temp"
    log_level = "DEBUG"
    server_address = "spire-server"
    server_port = "8081"
    socket_path = "/run/spire/sockets/agent.sock"
    trust_bundle_path = "/run/spire/bundle/bundle.crt"
    trust_domain = "example.org"
}

plugins {
    NodeAttestor "k8s_psat" {
        plugin_data {
            cluster = "example-cluster"
        }
    }

    KeyManager "memory" {
        plugin_data {}
    }

    WorkloadAttestor "k8s" {
        plugin_data {
            skip_kubelet_verification = true
        }
    }
}
By default the TTL was 1h for SVIDs and 12h for the CA but we tried to increase and decrease them without significant effect on the CPU utilization.
Based on our slack discussion, we tried to add batches of 20 pods on the cluster in 11 steps. The below diagram shows how the CPU utilization of the spire-agent pod increased in time:
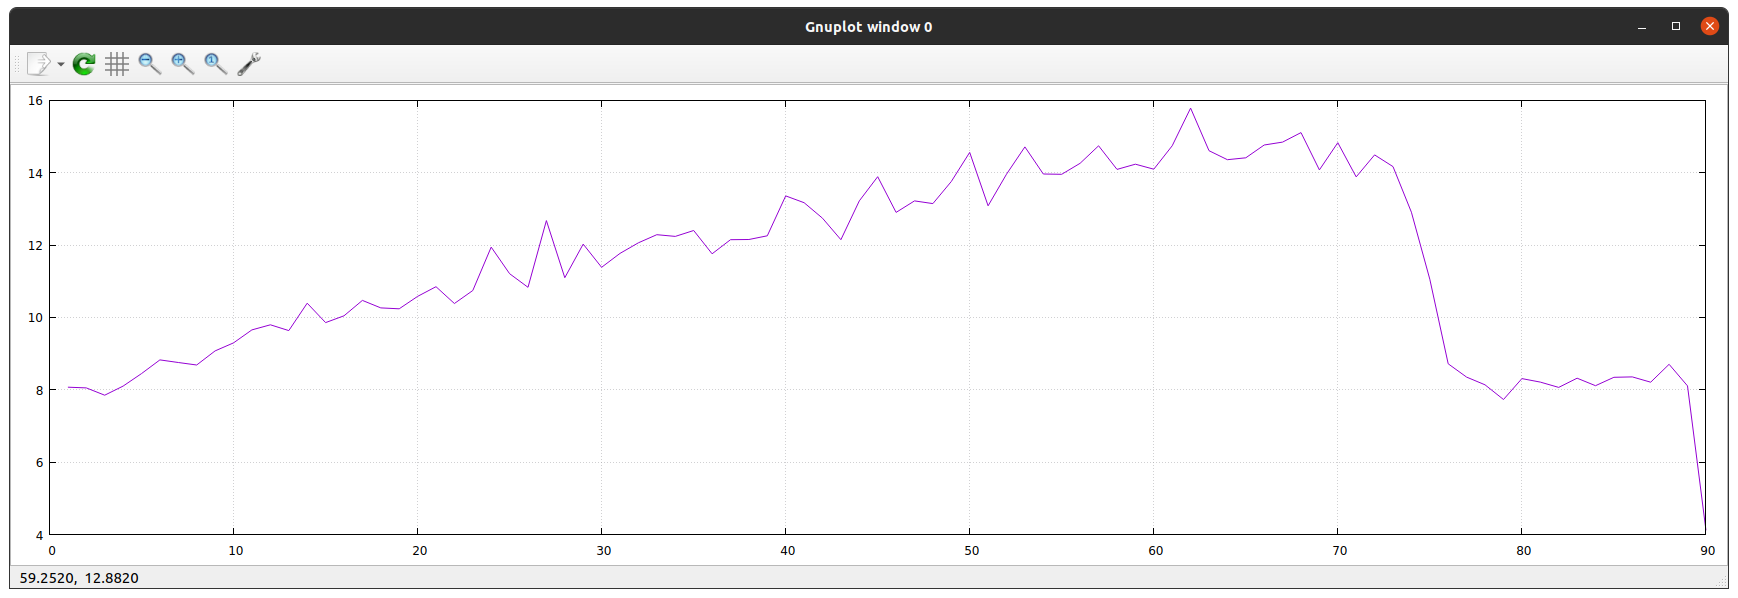 The utilization is quite linear with the increasing number of running pods. We experienced the same behavior on each worker nodes, so in the peak period spire-agent utilized ~15% of the CPU. Then it was broken down when deleted all the pods we created previously.
In the meantime the spire-agent logs don’t contain any suspicious activity that would show the agents would be busy at all.
The utilization is quite linear with the increasing number of running pods. We experienced the same behavior on each worker nodes, so in the peak period spire-agent utilized ~15% of the CPU. Then it was broken down when deleted all the pods we created previously.
In the meantime the spire-agent logs don’t contain any suspicious activity that would show the agents would be busy at all.
We managed to reproduce it on more clusters however the CPU utilization was different which we cannot explain. In understand that it depends on the amount of the running pods, but do all the processes running on that worker node count?
Do you have experience with crowded clusters with many pods, how spire-agent’s CPU utilization looks like? Is this the expected behavior?
About this issue
- Original URL
- State: closed
- Created a year ago
- Comments: 20 (20 by maintainers)
Commits related to this issue
- Fix for #3957 Signed-off-by: Szilard Vincze <szilard.vincze@est.tech> — committed to Nordix/spire by szvincze a year ago
- Fix for spiffe#3957 Signed-off-by: Szilard Vincze <szilard.vincze@est.tech> — committed to Nordix/spire by szvincze a year ago
- Fix for #3957 Signed-off-by: Szilard Vincze <szilard.vincze@est.tech> — committed to azdagron/spire by szvincze a year ago
- Fix for spiffe#3957 Signed-off-by: Szilard Vincze <szilard.vincze@est.tech> — committed to azdagron/spire by szvincze a year ago
The memory limit is 210Mi, but the actual memory consumption is way below that, and we are not tuning go gc at all.
On the one hand, I tried to reproduce the issue by decreasing the memory limit on another cluster where I haven’t observed high load at all. I managed to get similar profiling output but the memory limit was very-very low in this case…
On the other hand, we increased and even removed the memory limit on the problematic cluster but the CPU consumption remained as before.
I would highly appreciate if you could give a hint how to do it.