scrapy: Scrapy under Python 3 is slower than under Python 2
bookworm benchmark from https://github.com/scrapy/scrapy-bench/ (see also https://medium.com/@vermaparth/parth-gsoc-f5556ffa4025) shows about 15% slowdown, while more synthetic scrapy bench shows a 2x slowdown: https://github.com/scrapy/scrapy/pull/3050#issuecomment-353863711
About this issue
- Original URL
- State: open
- Created 6 years ago
- Comments: 22 (22 by maintainers)
I think I would start from comparing profiles (that means running under profiler) under Py2.7 and Py3.6 for several benchmarks and trying to spot where most of the difference comes from. For benchmarks, I think it makes sense to check several of them, because some might show more difference and some will be easier to analyze. For profilers, if you already have some preference then go with it. If not, I would suggest using built-in cProfile with some visualization backend (e.g. snakeviz), and vmprof + vmprof.com for visualization - it’s good to have several different profilers because this allows to cross-check profiling results.
I tried running scrapy bench again and again and result is really unpredictable. However, the speed difference between python 2 and python 3 is still really high (about 30%-40%). But then again, the result I copied from the last line of the log is pretty weird. So I made a line of report which divides the pages crawled to the elapsed time, then I ran the benchmarker again and got this result: Python2:
Python3:
As you can see the result is basically the same. But I noticed that the spider speed is much slower over time. I will take the log on python 3 as an example:
This also happens on Python 2 but it’s not that much. I guess that’s where the difference comes from.
@nctl144 sure, the main difference of vmprof is that it is a statistical profiler: https://en.wikipedia.org/wiki/Profiling_(computer_programming)#Statistical_profilers so it does not tell how many times a function was called, so it’s useful to check cProfile results as well. But as you many have noticed, it has lower overhead, especially when there are a lot of calls of small and fast functions.
Default mode of vmprof display is called a “flamegraph”, but there are two more modes reachable by the buttons on the bottom left in the screenshot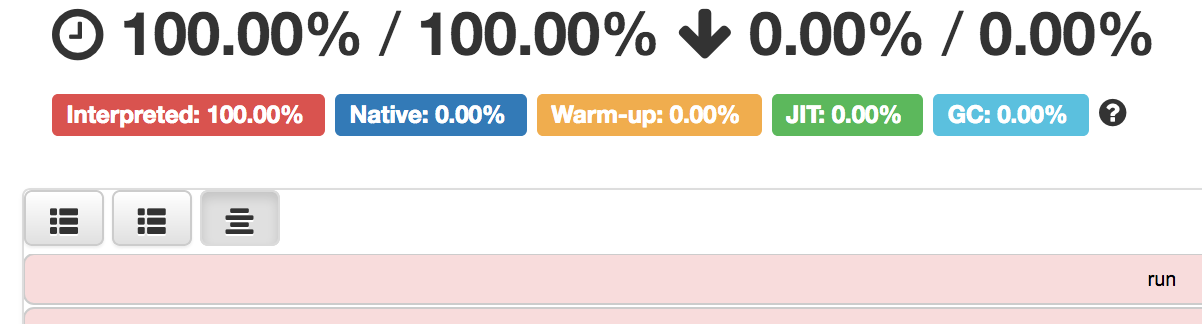
There you can get %-age of time spent in the function (both “safe” and “cumulative”).
@lopuhin Aight I got that! What I am doing now is concentrating on profiling the performance of
bookwormandscrapy benchon python2 and python3. Profiling with Snakeviz is fine since they have a doc which describes the profiling result in detail. However, since this is the first time I use vmprof so I don’t really know what information in the result page represents. I tried to look for the answers but I found none. Therefore, can you help me briefly explain the main parts that I need to pay attention to when looking at the vmprof result? I hope you dont mind 😃 Thank you so much! 😄Not really, I think first step is to measure and analyze the differences and where they come from, like hypothetically “urljoin (taking 20%) time overall is taking 100% more time under python 3, likely because of this and that”. Also I think it makes sense to profile
scrapy benchtoo - I remember the difference there was also quite large.Interesting results @nctl144 ! Btw, this issue https://github.com/scrapy/scrapy/issues/1306 could be also relevant here.