cartopy: Shared axes broken on pan
Description
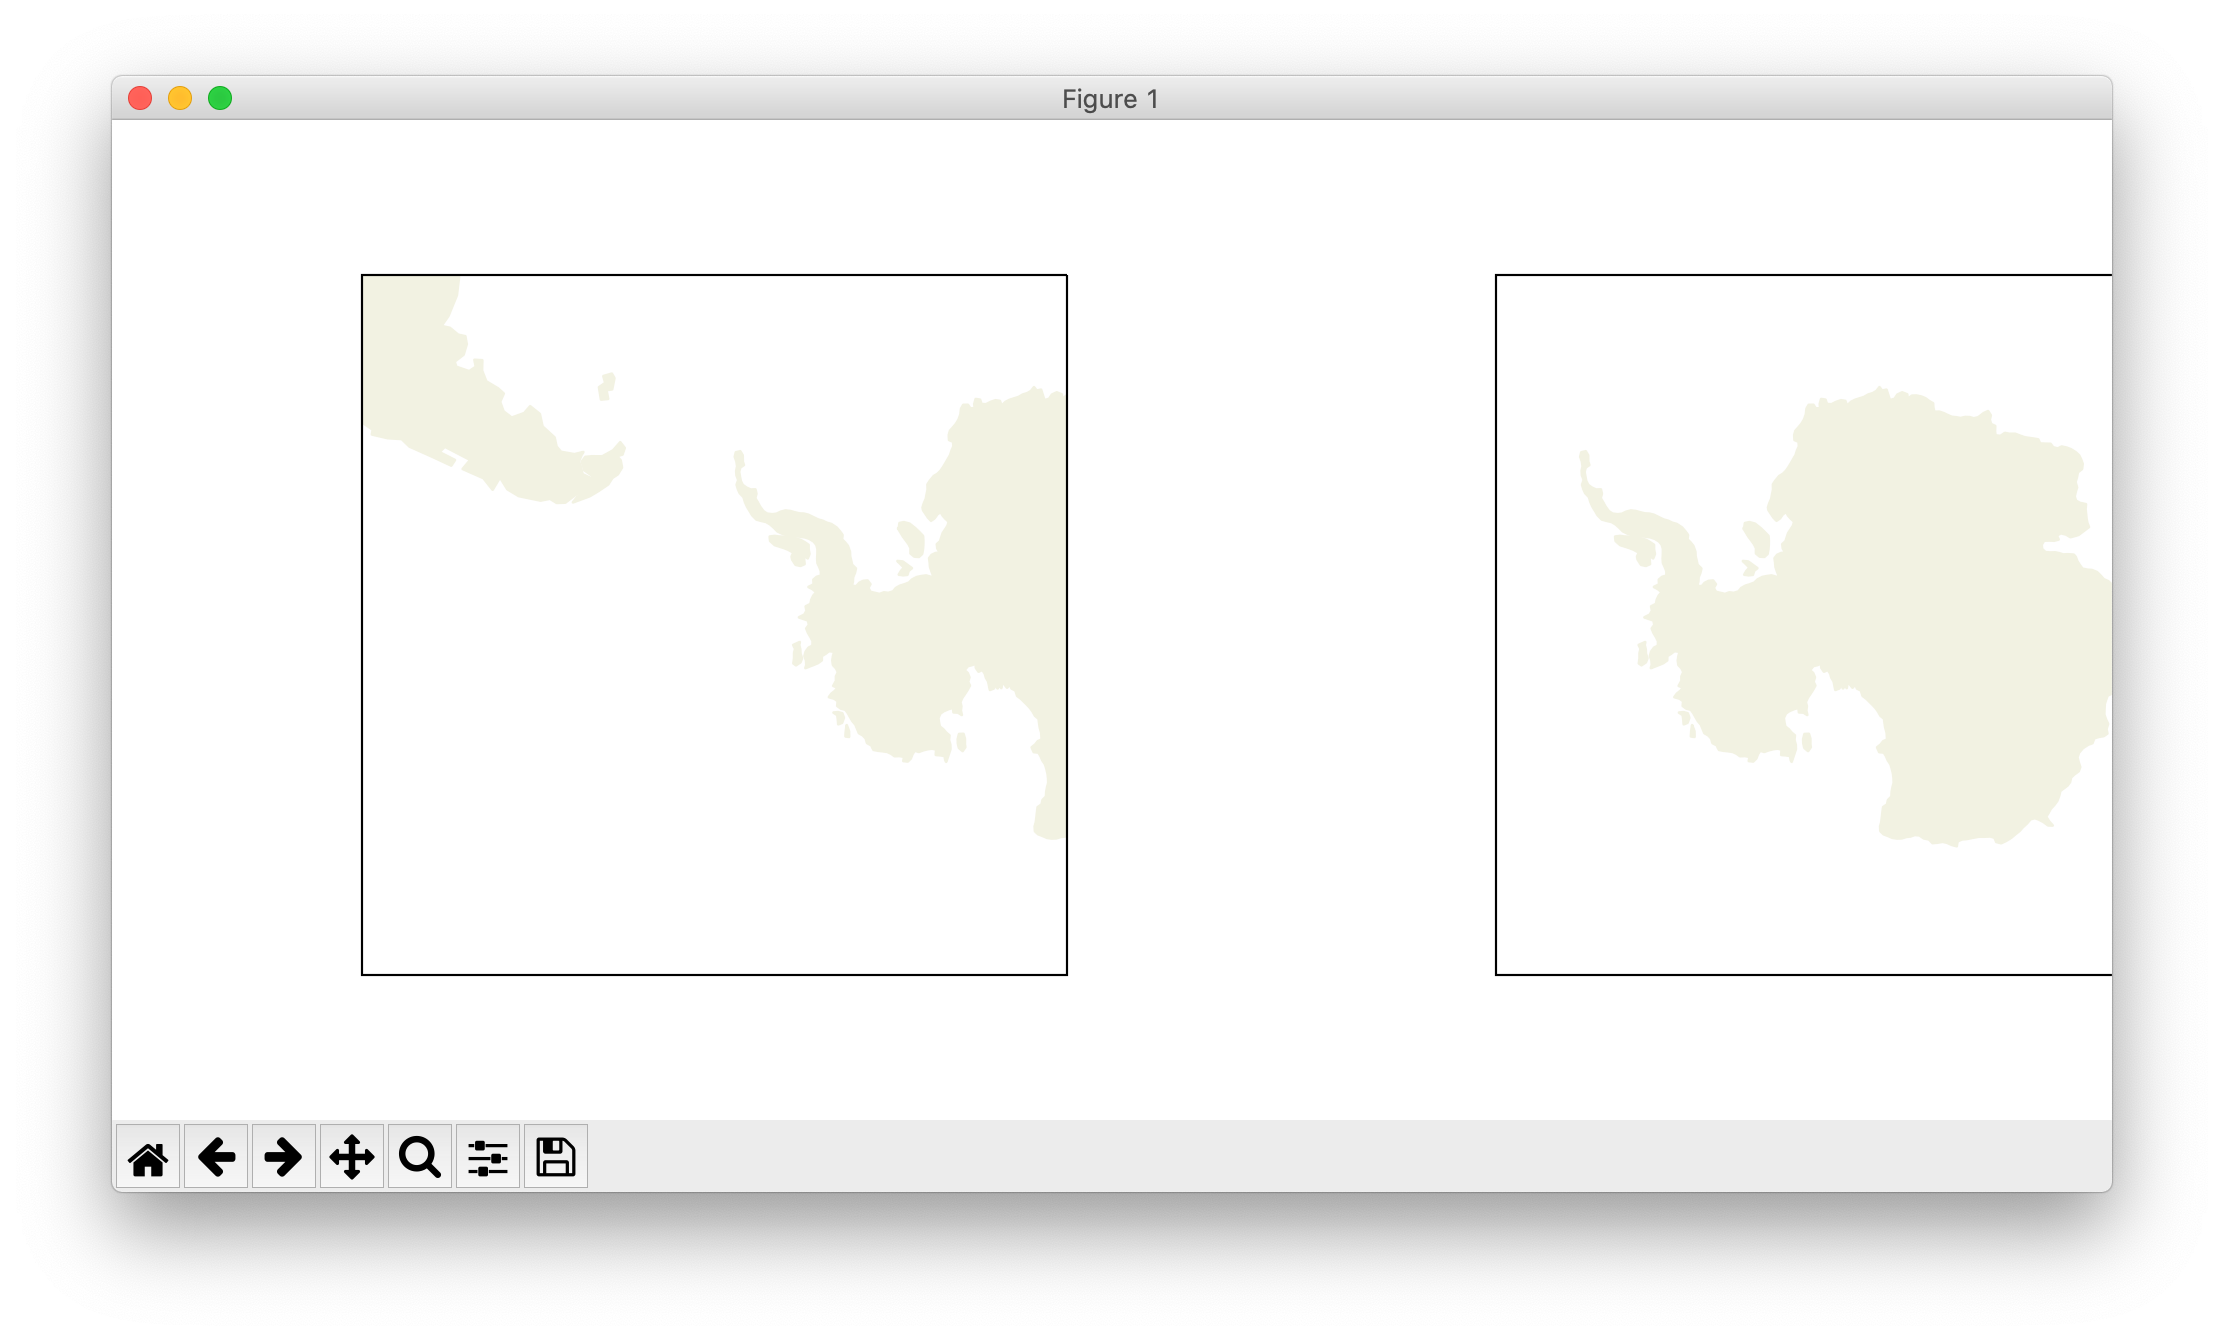
It looks like when sharing axes, and you pan one of them interactively, the other(s) move around. This is a consequence of our new (0.18) background patch and spine, which need to be updated with the data limits. When axes are shared, the original axes gets notified of data limits properly and re-clips as appropriate. Unfortunately, this not happening for any axes sharing the original–this is because when matplotlib syncs limit changes to shared axes, it explicitly says not to emit any events for those axes. 😞
Code to reproduce
import matplotlib.pyplot as plt
import cartopy.crs as ccrs
import cartopy.feature as cfeature

fig = plt.figure(figsize=[10, 5])
ax1 = fig.add_subplot(1, 2, 1, projection=ccrs.SouthPolarStereo())
ax2 = fig.add_subplot(1, 2, 2, projection=ccrs.SouthPolarStereo(), sharex=ax1)

# Limit the map to -60 degrees latitude and below.
ax1.set_extent([-180, 180, -90, -60], ccrs.PlateCarree())
ax2.set_extent([-180, 180, -90, -60], ccrs.PlateCarree())

ax1.add_feature(cfeature.LAND)
ax2.add_feature(cfeature.LAND)

plt.pause(0.01)

ax1.set_xlim(-6180148.99567504, 619506.5641910564)
plt.draw()

plt.show()
Gives:
Originally mentioned in #1620. The reason I’m opening the issue is because I’m really not sure what the cleanest way to fix this is:
-
Notify shared axes in our existing event callback. This requires using matplotlib’s private
_shared_x_axesand_shared_y_axes. Not wild about using private attributes, especially ones that have been refactored in the past. -
Override
set_xlimandset_ylimonGeoAxes. Can just set the stale flags when the limits are set. Might not even need the event callback any more. Downside is needing to match matplotlib’s extensive signature and docstring just so we can hook in. (If only there was some kind of event dispatch we could use…) Also need to deal with the fact that.patchis not available whenset_[y|x]limis first called, so feels…unclean. -
~Hook in somehow when axes are first shared and register event handler on limit changes on the other axes~ I didn’t even try this one, but it seems terrible.
-
?
I can confirm either (1) or (2) do solve the issue. Just not sure what’s the least annoying. Thoughts @QuLogic ? Any other ideas?
About this issue
- Original URL
- State: closed
- Created 4 years ago
- Comments: 15 (13 by maintainers)
I’ve implemented a crude fix that works nicely if the axes share the same projection in EOmaps (a library for interactive cartopy-maps I’m developing)
Here’s a stripped-down version of what I’m using … maybe it helps to come up with a proper solution:
@rcomer Indeed, I was still at matplotlib 3.7.2 in the env I’ve used for checking… sorry for that… With mpl 3.8.2 I get the same as you so it really seems to be fixed!