ray: [Core][Nightly-test] scheduling_test_many_0s_tasks_many_nodes failed
What happened + What you expected to happen
[2m[33m(raylet, ip=172.31.70.203)[0m [2022-04-24 20:11:54,239 E 133 133] (raylet) worker_pool.cc:502: Some workers of the worker process(2377) have not registered within the timeout. The process is still alive, probably it's hanging during start.
[2m[33m(raylet, ip=172.31.67.141)[0m [2022-04-24 20:11:54,373 E 133 133] (raylet) worker_pool.cc:502: Some workers of the worker process(2521) have not registered within the timeout. The process is still alive, probably it's hanging during start.
...
[2m[33m(raylet, ip=172.31.66.189)[0m [2022-04-24 20:12:46,747 E 133 133] (raylet) worker_pool.cc:502: Some workers of the worker process(4031) have not registered within the timeout. The process is still alive, probably it's hanging during start.
[2m[33m(raylet, ip=172.31.66.189)[0m [2022-04-24 20:12:46,756 E 133 133] (raylet) worker_pool.cc:502: Some workers of the worker process(4032) have not registered within the timeout. The process is still alive, probably it's hanging during start.
[2m[33m(raylet, ip=172.31.66.189)[0m [2022-04-24 20:12:46,761 E 133 133] (raylet) worker_pool.cc:502: Some workers of the worker process(4033) have not registered within the timeout. The process is still alive, probably it's hanging during start.
[2m[33m(raylet, ip=172.31.66.189)[0m [2022-04-24 20:12:46,768 E 133 133] (raylet) worker_pool.cc:502: Some workers of the worker process(4034) have not registered within the timeout. The process is still alive, probably it's hanging during start.
[2m[33m(raylet, ip=172.31.66.189)[0m [2022-04-24 20:12:46,771 E 133 133] (raylet) worker_pool.cc:502: Some workers of the worker process(4035) have not registered within the timeout. The process is still alive, probably it's hanging during start.
[2m[33m(raylet, ip=172.31.66.189)[0m [2022-04-24 20:12:46,775 E 133 133] (raylet) worker_pool.cc:502: Some workers of the worker process(4036) have not registered within the timeout. The process is still alive, probably it's hanging during start.
[2m[33m(raylet, ip=172.31.69.48)[0m [2022-04-24 20:12:47,093 E 133 133] (raylet) worker_pool.cc:502: Some workers of the worker process(3486) have not registered within the timeout. The process is still alive, probably it's hanging during start.
[2m[33m(raylet, ip=172.31.69.48)[0m [2022-04-24 20:12:47,098 E 133 133] (raylet) worker_pool.cc:502: Some workers of the worker process(3487) have not registered within the timeout. The process is still alive, probably it's hanging during start.
Traceback (most recent call last):
File "distributed/test_scheduling.py", line 105, in <module>
args.total_num_actors, args.num_actors_per_nodes, job
File "distributed/test_scheduling.py", line 53, in start_actor
lambda: ray.get([actor.do_job.remote() for actor in actors])
File "distributed/test_scheduling.py", line 38, in measure
ret = f()
File "distributed/test_scheduling.py", line 53, in <lambda>
lambda: ray.get([actor.do_job.remote() for actor in actors])
File "/home/ray/anaconda3/lib/python3.7/site-packages/ray/_private/client_mode_hook.py", line 105, in wrapper
return func(*args, **kwargs)
File "/home/ray/anaconda3/lib/python3.7/site-packages/ray/worker.py", line 1827, in get
raise value
ray.exceptions.RayActorError: The actor died unexpectedly before finishing this task.
Versions / Dependencies
lastet ray
Reproduction script
run nightly test
Issue Severity
High: It blocks me from completing my task.
About this issue
- Original URL
- State: closed
- Created 2 years ago
- Comments: 16 (15 by maintainers)
Current observations:
When using 32 nodes in the test, it is consistent that exactly 1 node has abnormal Raylet memory usage. When using 16 or 24 nodes in the test, no Raylet has abnormal memory usage.
Even after the test finishes and there is no longer any workload on the Ray cluster, the node still has the same high memory usage. e.g.
When the Raylet starts to have increasing memory usage, it is also starting to spawn workers.
The Raylet with high memory usage also receives abnormal number of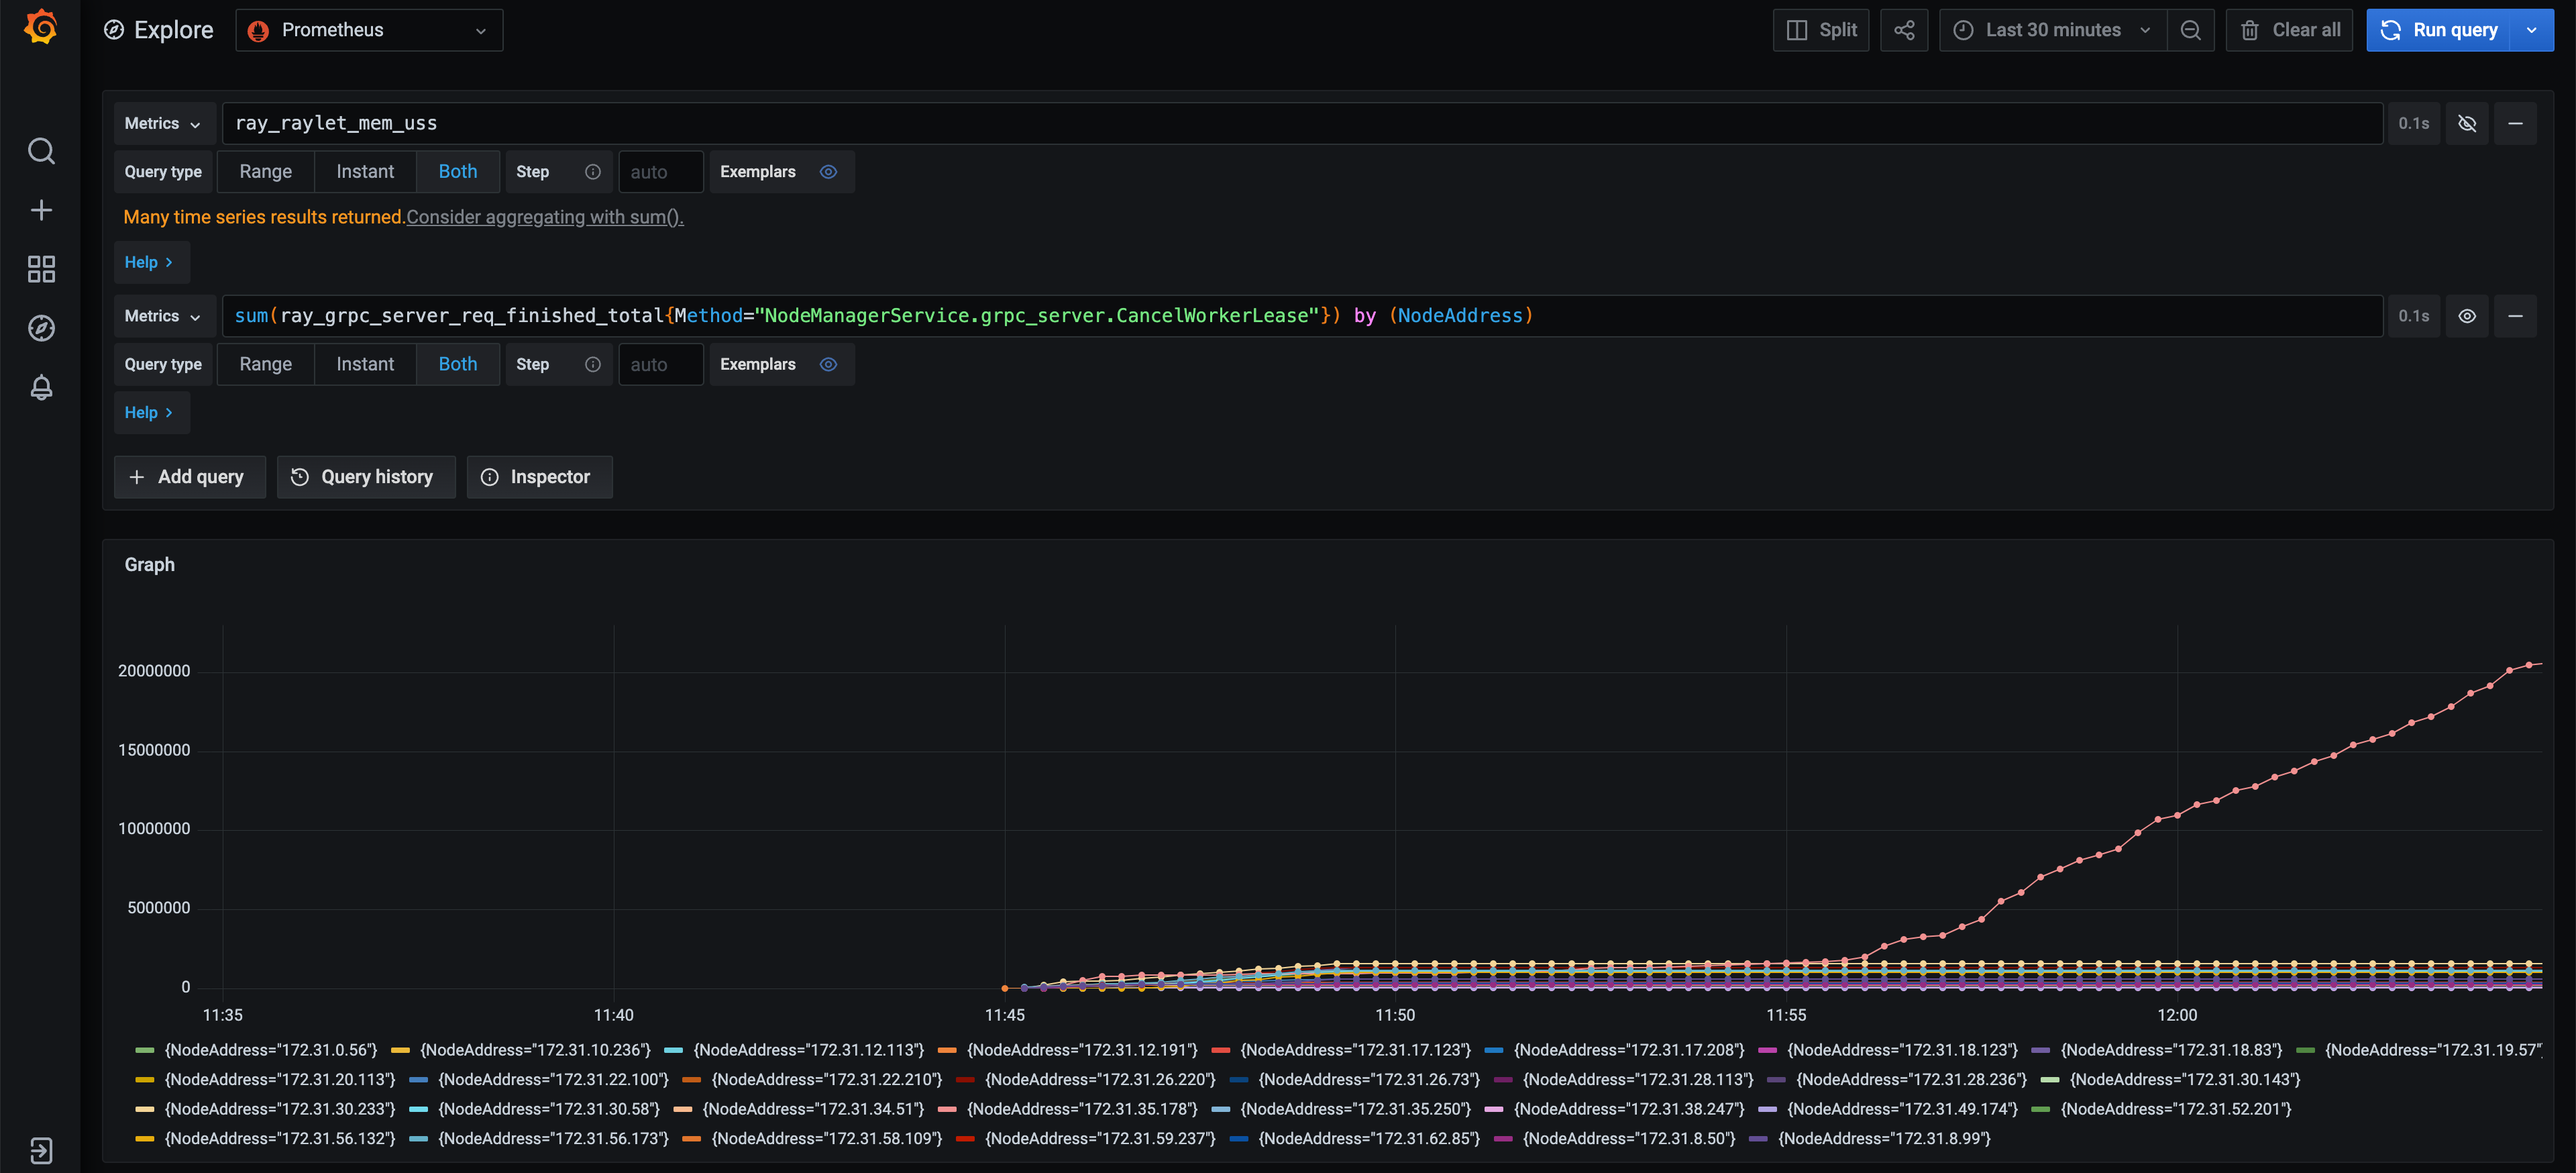
CancelWorkerLeaseRPCs. The correlation is strong (Raylet with highest memory usage <=> Raylet receiving highest number ofCancelWorkerLeaseRPCs) but I’m not sure of the causation here. Memory usage can grow or stay the same independent of the trend of newCancelWorkerLeasecalls.CancelWorkerLeasehas a suspicious retry logic in the client but it can be a separate issue.The memory usage increase disappears when using
jemalloc, with or without profiling enabled.Since memory profiling seems blocked by unable to reproduce the issue with profiling enabled, the next step is to fix all the suspicious behavior found during the investigations (e.g. #25626), and try to reproduce the issue on a single node.
@iycheng I was planning to investigate it later this week. Let me take a look today.
raylet was killed by oom