rancher: when no notifiers are configured, prometheus can't find alert manager and constantly logs
Rancher/rancher:v2.2.2 No notifiers are configured in the cluster, and I assume that no alert manager instances are deployed. If that is the case, then we should not set the alert manager config in prometheus. It tries to find it ever 6 minutes or so. Would be nice to have a clean log.
evel=info ts=2019-04-17T22:28:47.410721056Z caller=main.go:695 msg="Loading configuration file" filename=/etc/prometheus/config_out/prometheus.env.yaml
level=info ts=2019-04-17T22:28:47.466680554Z caller=kubernetes.go:201 component="discovery manager scrape" discovery=k8s msg="Using pod service account via in-cluster config"
level=info ts=2019-04-17T22:28:47.467915185Z caller=kubernetes.go:201 component="discovery manager scrape" discovery=k8s msg="Using pod service account via in-cluster config"
level=info ts=2019-04-17T22:28:47.46872607Z caller=kubernetes.go:201 component="discovery manager scrape" discovery=k8s msg="Using pod service account via in-cluster config"
level=info ts=2019-04-17T22:28:47.469568383Z caller=kubernetes.go:201 component="discovery manager scrape" discovery=k8s msg="Using pod service account via in-cluster config"
level=info ts=2019-04-17T22:28:47.47274569Z caller=main.go:722 msg="Completed loading of configuration file" filename=/etc/prometheus/config_out/prometheus.env.yaml
level=error ts=2019-04-17T22:28:47.595097871Z caller=notifier.go:481 component=notifier alertmanager=http://alertmanager-operated.cattle-prometheus:9093/api/v1/alerts count=0 msg="Error sending alert" err="Post http://alertmanager-operated.cattle-prometheus:9093/api/v1/alerts: dial tcp: lookup alertmanager-operated.cattle-prometheus on 10.31.0.10:53: no such host"
level=info ts=2019-04-17T22:34:47.597693835Z caller=main.go:695 msg="Loading configuration file" filename=/etc/prometheus/config_out/prometheus.env.yaml
level=info ts=2019-04-17T22:34:47.89329663Z caller=kubernetes.go:201 component="discovery manager scrape" discovery=k8s msg="Using pod service account via in-cluster config"
level=info ts=2019-04-17T22:34:47.894429793Z caller=kubernetes.go:201 component="discovery manager scrape" discovery=k8s msg="Using pod service account via in-cluster config"
level=info ts=2019-04-17T22:34:47.895314721Z caller=kubernetes.go:201 component="discovery manager scrape" discovery=k8s msg="Using pod service account via in-cluster config"
level=info ts=2019-04-17T22:34:47.89624308Z caller=kubernetes.go:201 component="discovery manager scrape" discovery=k8s msg="Using pod service account via in-cluster config"
level=info ts=2019-04-17T22:34:47.899885093Z caller=main.go:722 msg="Completed loading of configuration file" filename=/etc/prometheus/config_out/prometheus.env.yaml
level=error ts=2019-04-17T22:34:52.615082709Z caller=notifier.go:481 component=notifier alertmanager=http://alertmanager-operated.cattle-prometheus:9093/api/v1/alerts count=0 msg="Error sending alert" err="Post http://alertmanager-operated.cattle-prometheus:9093/api/v1/alerts: dial tcp: lookup alertmanager-operated.cattle-prometheus on 10.31.0.10:53: no such host"
level=info ts=2019-04-17T22:40:47.410780055Z caller=main.go:695 msg="Loading configuration file" filename=/etc/prometheus/config_out/prometheus.env.yaml
level=info ts=2019-04-17T22:40:47.486244501Z caller=kubernetes.go:201 component="discovery manager scrape" discovery=k8s msg="Using pod service account via in-cluster config"
level=info ts=2019-04-17T22:40:47.487459958Z caller=kubernetes.go:201 component="discovery manager scrape" discovery=k8s msg="Using pod service account via in-cluster config"
level=info ts=2019-04-17T22:40:47.488555538Z caller=kubernetes.go:201 component="discovery manager scrape" discovery=k8s msg="Using pod service account via in-cluster config"
level=info ts=2019-04-17T22:40:47.489660993Z caller=kubernetes.go:201 component="discovery manager scrape" discovery=k8s msg="Using pod service account via in-cluster config"
level=info ts=2019-04-17T22:40:47.4932466Z caller=main.go:722 msg="Completed loading of configuration file" filename=/etc/prometheus/config_out/prometheus.env.yaml
level=error ts=2019-04-17T22:40:52.615534267Z caller=notifier.go:481 component=notifier alertmanager=http://alertmanager-operated.cattle-prometheus:9093/api/v1/alerts count=0 msg="Error sending alert" err="Post http://alertmanager-operated.cattle-prometheus:9093/api/v1/alerts: dial tcp: lookup alertmanager-operated.cattle-prometheus on 10.31.0.10:53: no such host"
About this issue
- Original URL
- State: open
- Created 5 years ago
- Comments: 24
We placed the values in Rancher -> Cluster -> Tools -> Monitoring ->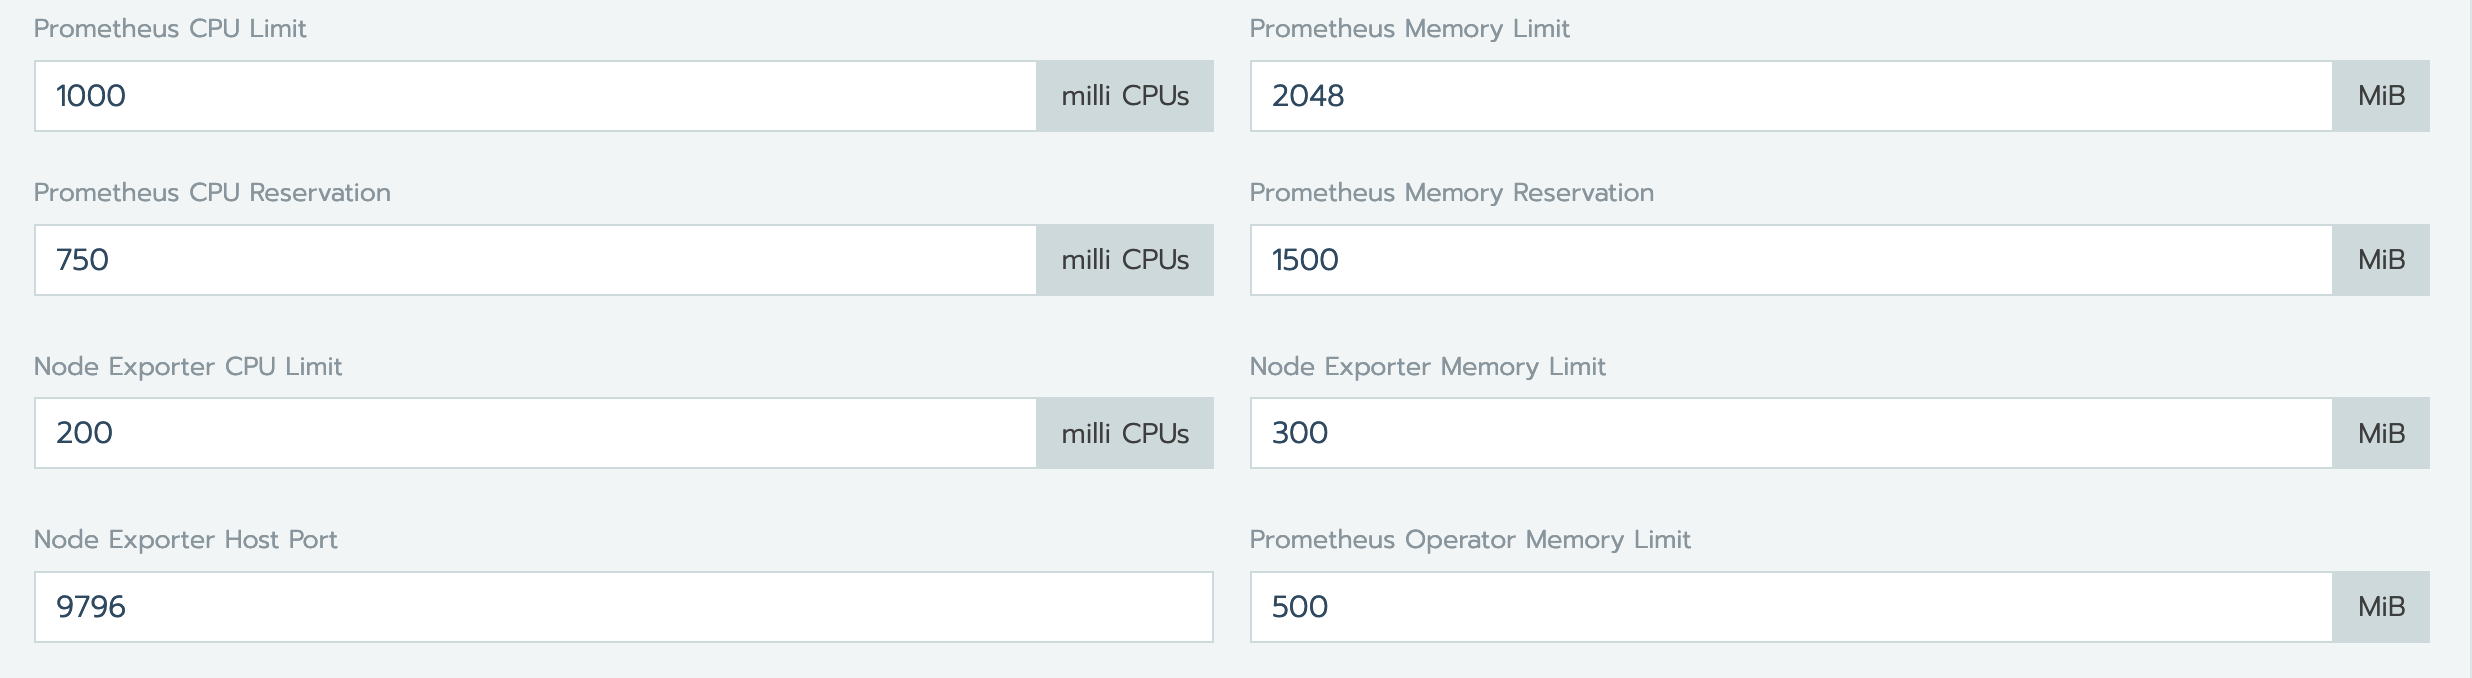
The values itself are actually depending on your workload amounts.
rancher v2.4.5 This problem still exists
2020/08/25 09:26:12 [ERROR] Failed to send alert: Post http://alertmanager-operated.cattle-prometheus.svc.cluster.local:9093/api/v1/alerts: dial tcp: lookup alertmanager-operated.cattle-prometheus.svc.cluster.local on 10.204.3.168:53: no su E0825 09:26:20.495601 33 watcher.go:214] watch chan error: etcdserver: mvcc: required revision has been compacted
Same here. Cluster-Monitoring runs fine for a couple of days, then “Monitoring API is not ready” and the prometheus container logs :
In addition the prometheus-agent logs the following and restarts over