rancher: Weird etcdHighNumberOfFailedGRPCRequests prometheus rule in v2.5 rancher-monitoring
I just was trying out the v2.5 monitoring chart and noticed that I was getting a large number of alerts for
etcdHighNumberOfFailedGRPCRequests for kube-etcd (alertname="etcdHighNumberOfFailedGRPCRequests", grpc_method="Watch", grpc_service="etcdserverpb.Watch", prometheus="monitoring/monitoring-rancher-monitor-prometheus", severity="critical")
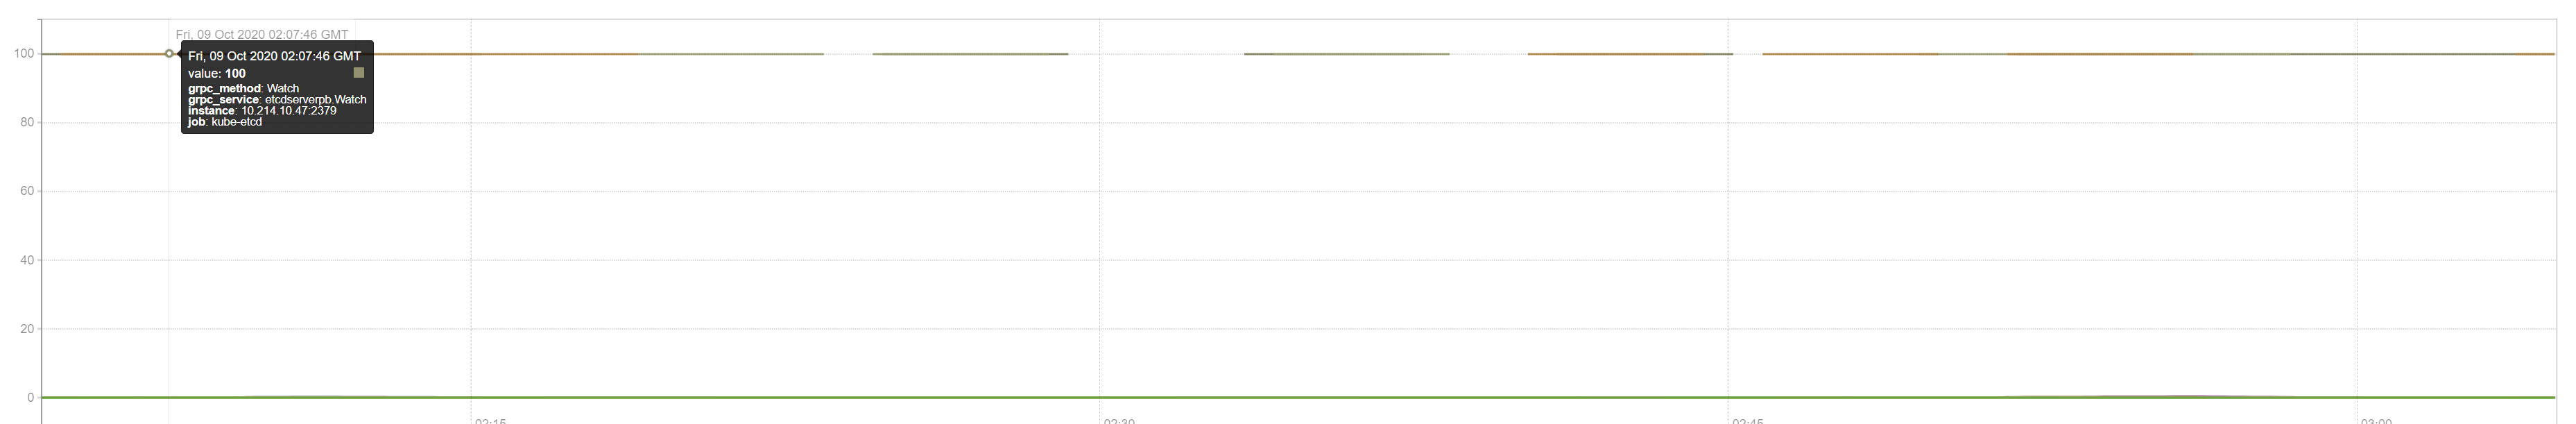
I took a look at the rules and something struck me as odd. This is the expression used to determine this alert: 100 * sum(rate(grpc_server_handled_total{job=~".*etcd.*", grpc_code!="OK"}[5m])) BY (job, instance, grpc_service, grpc_method) / sum(rate(grpc_server_handled_total{job=~".*etcd.*"}[5m])) BY (job, instance, grpc_service, grpc_method)
Which seems to result in garbage data:
However changing BY (job, instance, grpc_service, grpc_method) with simply BY (instance) seems to produce a much more meaningful metric (% grpc failed per node)
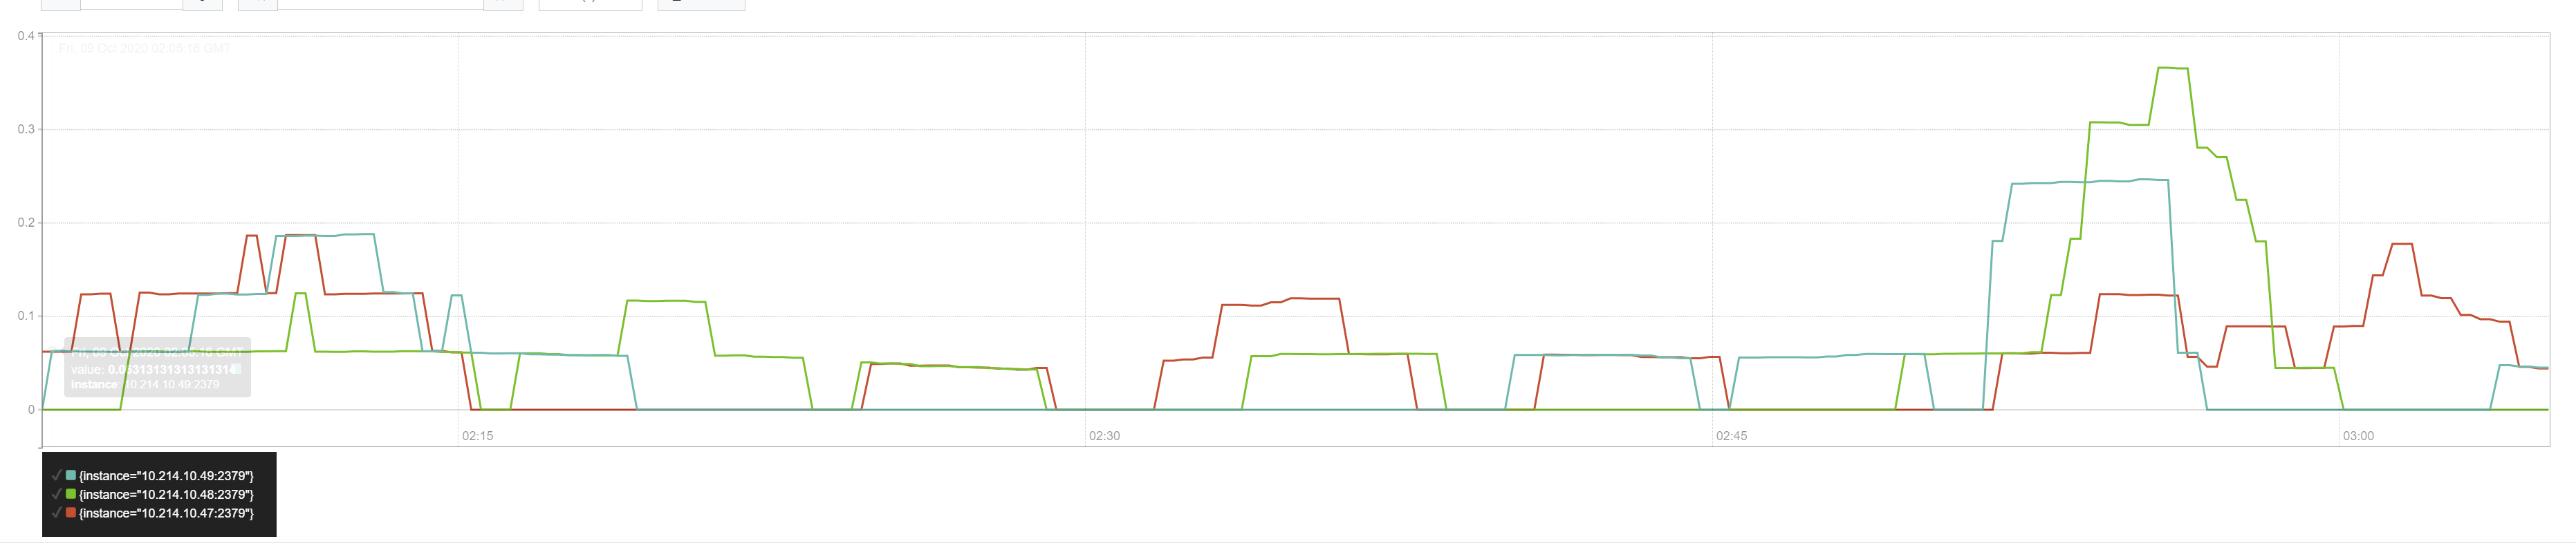
From my perspective, it seems like it should be changed to BY (instance) as this seems to make more sense but not 100% sure. I am very new to Prometheus in general.
gz#14464 gz#14015
gz#14746
gz#15416
gz#16124 gz#16211
About this issue
- Original URL
- State: closed
- Created 4 years ago
- Reactions: 15
- Comments: 33 (6 by maintainers)
Update: upstream still has not updated their dashboards primarily because etcd has not updated the dashboards published on their website.
To get this change from the upstream chart:
contrib/mixin/mixin.libsonnet- DONEcontent/en/docs/v3.4/op-guide/etcd3_alert.rules.ymlmust be manually synced based on the above merged contents - NOT DONEcc: @Jono-SUSE-Rancher @snasovich it may make sense to prioritize this issue as a patch on Monitoring directly since it’s been over a year since the original PR was merged in.
Let me try to summarize the issue:
grpc_code!="OK"part: it treats other non-error codes (canceled, invalidArgument, notFound, and etc) as errors so the expression reports a high rate of errors thus triggers too many alerts (see GRPC standard here).kube-prometheus-stackrepo: notice that the wrong expression is still in the main branchFor rancher-monitoring charts, I think we can patch the expression instead of waiting for the upstream’s fix.
@MKlimuszka Could you please link the commit where this is fixed?
So this means in the current versions these are expected “issues”…
So “best option until fix” is to…silence alerts coming from etcd?
The cause of the frequent etcdHighNumberOfFailedGRPCRequests alarms is not the metric expression itself.
The output of the existing expression with
by:100 * sum by(job, instance, grpc_service, grpc_method) (rate(grpc_server_handled_total{grpc_code!="OK",job=~".*etcd.*"}[5m])) / sum by(job, instance, grpc_service, grpc_method) (rate(grpc_server_handled_total{job=~".*etcd.*"}[5m]))does not differ from the new expression using
without:100 * sum(rate(grpc_server_handled_total{job=~".*etcd.*", grpc_code!="OK"}[5m])) without (grpc_type, grpc_code) / sum(rate(grpc_server_handled_total{job=~".*etcd.*"}[5m])) without (grpc_type, grpc_code)The high number of alerts is caused by the upstream etcd issue tracked in https://github.com/etcd-io/etcd/issues/10289, with PR https://github.com/etcd-io/etcd/pull/12196 open to address this. Until this is fixed, silencing or removing this specific alert will address the alert noise.
For kube-prometheus-stack user that are coming along this issue.
I put this in the helm values.yml file for a temporary fix:
The queries do not include the ‘without’ clauses, but the results are looking good to me:
I don’t think so. I’m running Rancher 2.5.9, fresh install of the monitoring solution, and I’m seeing this alert on clusters running 3 etcd instances. I’m silencing it for now, hoping we don’t need to in the future.
My cluster is healthy and fairly sable, and I also get these constantly. I eventually silenced them through the alertmanager secret (under
alertmanager.yaml):Hi @aiyengar2 yeah I realised that after digging into things a little deeper. I actually opened that issue 😃 but yes just waiting to see what happens there. Thanks for the response
Pass Verified in
2.7.0-rc8no longer receiving high number of alerts for etcdHighNumberOfFailedGRPCRequestsHi @ccittadino-ctic, maybe I misunderstand something about the issue or you linked the wrong issue? I’m not sure how prometheus-community/helm-charts/225 is related. I do however see that the PR that Alex linked, which is the root cause of this issue, has been merged for etcd v3.5.0-alpha and may be backported to v3.4.x When this is done, we should see these alerts clear up. In the meantime, a good workaround would be to silence or remove this alert and make sure you have other alerts set up to track etcd health.