pvlib-python: Wrong values for DNI calculation
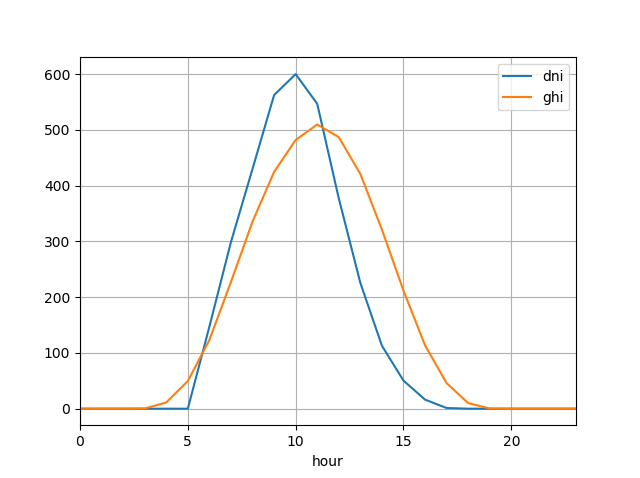
Describe the bug I am calculating a year of DNI values with the DISC model. The highest output values are in the morning hours and not around noon. Looks like a time shift.
In the following table, you can see the mean for every hour of the whole year. GHI and DHI are my input values.
           dni         ghi         dhi
0     0.000000    0.000000    0.000000
1     0.000000    0.000000    0.000000
2     0.000000    0.000000    0.000000
3     0.000000    0.327671    0.302192
4     0.000000   11.089863    8.771507
5   157.377499   49.600274   32.492877
6   293.910088  123.240000   66.184658
7   405.557090  227.243836  103.245753
8   511.518952  335.350137  135.290685
9   520.851959  424.490685  156.915616
10  489.100594  481.686301  171.890685
11  447.388485  509.470137  180.929863
12  381.863784  486.880274  181.015342
13  304.504728  420.844932  169.425205
14  216.274204  321.139726  139.355342
15  127.797036  211.764384  103.553151
16   64.359863  113.658356   61.655890
17   16.287984   45.800548   30.003014
18    0.185598   10.009589    7.995068
19    0.000000    0.311781    0.308219
20    0.000000    0.000000    0.000000
21    0.000000    0.000000    0.000000
22    0.000000    0.000000    0.000000
23    0.000000    0.000000    0.000000
To Reproduce
location = pvlib.location.Location(45.37,
                                                8.25 ,
                                                'UTC',
                                                100,
                                                'ghi_2018')
solar_position = location.get_solarposition(ghi.index)
total_irrad = pd.DataFrame(pvlib.irradiance.disc(
            ghi,
            solar_position['apparent_zenith'],
            ghi.index)['dni'],
                                        index=ghi.index,
                                        columns=['dni'])
total_irrad['ghi'] = ghi
Screenshots
 Versions:
pvlib.__version__: 0.6.0pandas.__version__: 0.23.4- python: 3.6
Additional context Add any other context about the problem here.
About this issue
- Original URL
- State: closed
- Created 5 years ago
- Comments: 16 (9 by maintainers)
Dear all, thanks for the support. The averaging was the baddy! Since we are using end timestamps i only had to shift the timestamp for 30 minutes in the middle of the hour because this might be the most representativ timestamp for the corresponding value. Thanks a lot. In the end i wanted to simulate singleaxistracker. The result matches my expectations now.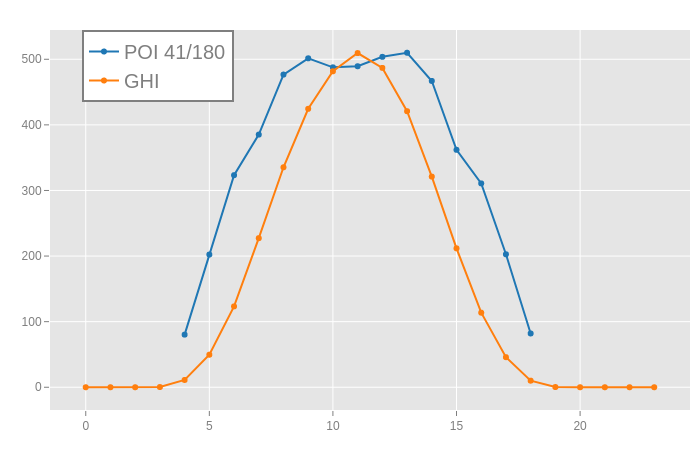
@meteoDaniel thanks for trying to work this through. Pandas timezones can be tricky.
I think you should consider posting your question on stack overflow or Google groups as explained in getting support. I can’t guaranty that you’ll find an answer, but with more eyes looking at your issue it may be easier to solve.
Also please consider posting a minimum complete verifiable example that others can use to understand your issue.
A couple of ideas.
Good luck! Keep trying. Stay positive. I know this can be solved 😃
If the timestamps are UTC then @mikofski’s example should be changed to
@meteoDaniel please see if you can reproduce the issue with just a few times.
Hi @meteoDaniel, I believe you are missing timezones from your indices. Your Location uses UTC, but your latitude and longitude put you in the central European timezone which is GMT +1.
Try this:
Although I suspect @cwhanse is correct that in addition there is some time averaging going on, because it looks like you are still off by an hour?