prometheus: Prometheus 2.2.0 missing metrics after upgrade
What did you do?
- Upgraded Prometheus to 2.2.0 from 2.1.0. I have Prometheus running on a container.
What did you expect to see? All metrics except the ones missing during container reload and start. No more than a few minutes.
What did you see instead? Under which circumstances? After I updated everything was running fine. New metrics were being collected and stored. A day after a gap of metrics went missing. A few hours ago I was able to see the now missing metrics. They were there and a second after they not.
The really weird thing here is that I have 4 Prometheus running and all 4 have the same issue, they were upgraded almost at the same time. Theres a long missing gap of metrics (all kind of metrics from different exporters) and no errors on logs.
These 4 Prometheus are running on separated environments on two different AWS regions.
Environment
- System information:
Linux 4.4.0-1050-aws x86_64
- Prometheus version:
prometheus, version 2.2.0 (branch: HEAD, revision: f63e7db4cbdb616337ca877b306b9b96f7f4e381)
  build user:       root@52af9f66ce71
  build date:       20180308-16:40:42
  go version:       go1.10
- Prometheus configuration file:
global:
  scrape_interval:     30s
  evaluation_interval: 30s

rule_files:
  - "/etc/prometheus-rules/*.yaml"
I cut the scrap rules here. I can include some of them.
- Logs:
➜  ~ oc logs prometheus-0
level=info ts=2018-03-08T19:58:19.858089342Z caller=main.go:220 msg="Starting Prometheus" version="(version=2.2.0, branch=HEAD, revision=f63e7db4cbdb616337ca877b306b9b96f7f4e381)"
level=info ts=2018-03-08T19:58:19.858143946Z caller=main.go:221 build_context="(go=go1.10, user=root@52af9f66ce71, date=20180308-16:40:42)"
level=info ts=2018-03-08T19:58:19.85817058Z caller=main.go:222 host_details="(Linux 4.4.0-1050-aws #59-Ubuntu SMP Tue Jan 30 19:57:10 UTC 2018 x86_64 prometheus-0 (none))"
level=info ts=2018-03-08T19:58:19.858192518Z caller=main.go:223 fd_limits="(soft=1048576, hard=1048576)"
level=info ts=2018-03-08T19:58:19.860731333Z caller=main.go:504 msg="Starting TSDB ..."
level=info ts=2018-03-08T19:58:19.860805283Z caller=web.go:382 component=web msg="Start listening for connections" address=0.0.0.0:9090
level=info ts=2018-03-08T19:58:19.861098766Z caller=repair.go:41 component=tsdb msg="fixing broken block" ulid=01C6BPGD3E1EH9N7XPAVWD3NSE
level=info ts=2018-03-08T19:59:25.431695736Z caller=repair.go:41 component=tsdb msg="fixing broken block" ulid=01C7ZP0PKNFRPMFKCSZ482VQ4C
level=info ts=2018-03-08T20:01:31.382327527Z caller=repair.go:41 component=tsdb msg="fixing broken block" ulid=01C81J69ME1Y5WSSAPERH4C94V
level=info ts=2018-03-08T20:01:43.390153611Z caller=repair.go:41 component=tsdb msg="fixing broken block" ulid=01C83FYTCPZS7KMSM2FR4A98V6
level=info ts=2018-03-08T20:04:04.520191875Z caller=main.go:514 msg="TSDB started"
level=info ts=2018-03-08T20:04:04.520258667Z caller=main.go:588 msg="Loading configuration file" filename=/etc/prometheus/prometheus.yml
level=info ts=2018-03-08T20:04:04.523593179Z caller=kubernetes.go:191 component="discovery manager scrape" discovery=k8s msg="Using pod service account via in-cluster config"
level=info ts=2018-03-08T20:04:04.525461109Z caller=kubernetes.go:191 component="discovery manager scrape" discovery=k8s msg="Using pod service account via in-cluster config"
level=info ts=2018-03-08T20:04:04.526788217Z caller=kubernetes.go:191 component="discovery manager scrape" discovery=k8s msg="Using pod service account via in-cluster config"
level=info ts=2018-03-08T20:04:04.527932416Z caller=kubernetes.go:191 component="discovery manager scrape" discovery=k8s msg="Using pod service account via in-cluster config"
level=info ts=2018-03-08T20:04:04.528997091Z caller=kubernetes.go:191 component="discovery manager scrape" discovery=k8s msg="Using pod service account via in-cluster config"
level=info ts=2018-03-08T20:04:04.530311675Z caller=kubernetes.go:191 component="discovery manager scrape" discovery=k8s msg="Using pod service account via in-cluster config"
level=info ts=2018-03-08T20:04:04.535204808Z caller=main.go:491 msg="Server is ready to receive web requests."
level=info ts=2018-03-08T21:00:00.34165268Z caller=compact.go:394 component=tsdb msg="compact blocks" count=1 mint=1520532000000 maxt=1520539200000
level=info ts=2018-03-08T21:01:52.439372087Z caller=head.go:348 component=tsdb msg="head GC completed" duration=8.816932002s
level=info ts=2018-03-08T21:02:44.010010328Z caller=head.go:357 component=tsdb msg="WAL truncation completed" duration=51.570547607s
level=info ts=2018-03-08T23:00:00.347972278Z caller=compact.go:394 component=tsdb msg="compact blocks" count=1 mint=1520539200000 maxt=1520546400000
level=info ts=2018-03-08T23:01:32.876783605Z caller=head.go:348 component=tsdb msg="head GC completed" duration=6.039842235s
level=info ts=2018-03-08T23:02:32.551701808Z caller=head.go:357 component=tsdb msg="WAL truncation completed" duration=59.674864681s
level=info ts=2018-03-09T01:00:00.388711357Z caller=compact.go:394 component=tsdb msg="compact blocks" count=1 mint=1520546400000 maxt=1520553600000
level=info ts=2018-03-09T01:00:59.131562889Z caller=head.go:348 component=tsdb msg="head GC completed" duration=2.507758629s
level=info ts=2018-03-09T01:01:18.039357855Z caller=head.go:357 component=tsdb msg="WAL truncation completed" duration=18.907736139s
level=info ts=2018-03-09T03:00:00.380318607Z caller=compact.go:394 component=tsdb msg="compact blocks" count=1 mint=1520553600000 maxt=1520560800000
level=info ts=2018-03-09T03:00:58.488065341Z caller=head.go:348 component=tsdb msg="head GC completed" duration=2.314473094s
level=info ts=2018-03-09T03:01:13.31888004Z caller=head.go:357 component=tsdb msg="WAL truncation completed" duration=14.830755016s
level=info ts=2018-03-09T03:01:18.881154001Z caller=compact.go:394 component=tsdb msg="compact blocks" count=3 mint=1520532000000 maxt=1520553600000
level=info ts=2018-03-09T05:00:00.388120222Z caller=compact.go:394 component=tsdb msg="compact blocks" count=1 mint=1520560800000 maxt=1520568000000
level=info ts=2018-03-09T05:00:57.704584177Z caller=head.go:348 component=tsdb msg="head GC completed" duration=2.51049056s
level=info ts=2018-03-09T05:01:12.057612041Z caller=head.go:357 component=tsdb msg="WAL truncation completed" duration=14.352969524s
level=info ts=2018-03-09T07:00:00.387250785Z caller=compact.go:394 component=tsdb msg="compact blocks" count=1 mint=1520568000000 maxt=1520575200000
level=info ts=2018-03-09T07:00:58.776859178Z caller=head.go:348 component=tsdb msg="head GC completed" duration=2.339181202s
level=info ts=2018-03-09T07:01:13.64668469Z caller=head.go:357 component=tsdb msg="WAL truncation completed" duration=14.869760955s
level=info ts=2018-03-09T09:00:00.398864782Z caller=compact.go:394 component=tsdb msg="compact blocks" count=1 mint=1520575200000 maxt=1520582400000
level=info ts=2018-03-09T09:00:58.889449072Z caller=head.go:348 component=tsdb msg="head GC completed" duration=2.79196883s
level=info ts=2018-03-09T09:01:13.508749265Z caller=head.go:357 component=tsdb msg="WAL truncation completed" duration=14.619235883s
level=info ts=2018-03-09T09:01:18.898146261Z caller=compact.go:394 component=tsdb msg="compact blocks" count=3 mint=1520553600000 maxt=1520575200000
level=info ts=2018-03-09T11:00:00.387036989Z caller=compact.go:394 component=tsdb msg="compact blocks" count=1 mint=1520582400000 maxt=1520589600000
level=info ts=2018-03-09T11:00:57.685609508Z caller=head.go:348 component=tsdb msg="head GC completed" duration=2.371068823s
level=info ts=2018-03-09T11:01:12.734211593Z caller=head.go:357 component=tsdb msg="WAL truncation completed" duration=15.048545238s
level=info ts=2018-03-09T13:00:00.389210695Z caller=compact.go:394 component=tsdb msg="compact blocks" count=1 mint=1520589600000 maxt=1520596800000
level=info ts=2018-03-09T13:00:58.341825994Z caller=head.go:348 component=tsdb msg="head GC completed" duration=2.466301791s
level=info ts=2018-03-09T13:01:13.191514211Z caller=head.go:357 component=tsdb msg="WAL truncation completed" duration=14.849637465s
level=info ts=2018-03-09T15:00:00.373007915Z caller=compact.go:394 component=tsdb msg="compact blocks" count=1 mint=1520596800000 maxt=1520604000000
level=info ts=2018-03-09T15:01:30.790025421Z caller=head.go:348 component=tsdb msg="head GC completed" duration=4.111489989s
level=info ts=2018-03-09T15:02:04.571961721Z caller=head.go:357 component=tsdb msg="WAL truncation completed" duration=33.7818842s
level=info ts=2018-03-09T15:02:18.425767053Z caller=compact.go:394 component=tsdb msg="compact blocks" count=3 mint=1520575200000 maxt=1520596800000
level=info ts=2018-03-09T15:03:30.118738573Z caller=compact.go:394 component=tsdb msg="compact blocks" count=2 mint=1520532000000 maxt=1520575200000
level=info ts=2018-03-09T15:05:31.944625635Z caller=compact.go:394 component=tsdb msg="compact blocks" count=3 mint=1520402400000 maxt=1520596800000
level=info ts=2018-03-09T17:00:00.347731895Z caller=compact.go:394 component=tsdb msg="compact blocks" count=1 mint=1520604000000 maxt=1520611200000
level=info ts=2018-03-09T17:01:35.110319556Z caller=head.go:348 component=tsdb msg="head GC completed" duration=6.699952835s
level=info ts=2018-03-09T17:02:46.732035127Z caller=head.go:357 component=tsdb msg="WAL truncation completed" duration=1m11.62087854s
level=info ts=2018-03-09T17:02:51.604621507Z caller=compact.go:394 component=tsdb msg="compact blocks" count=2 mint=1520402400000 maxt=1520575200000
Production Ireland
The last metric of 2.1.0 is the green one and ends when I upgraded Prometheus (19:58). On the logs you can see that the cointainer started at 19:58:19


Staging Virginia
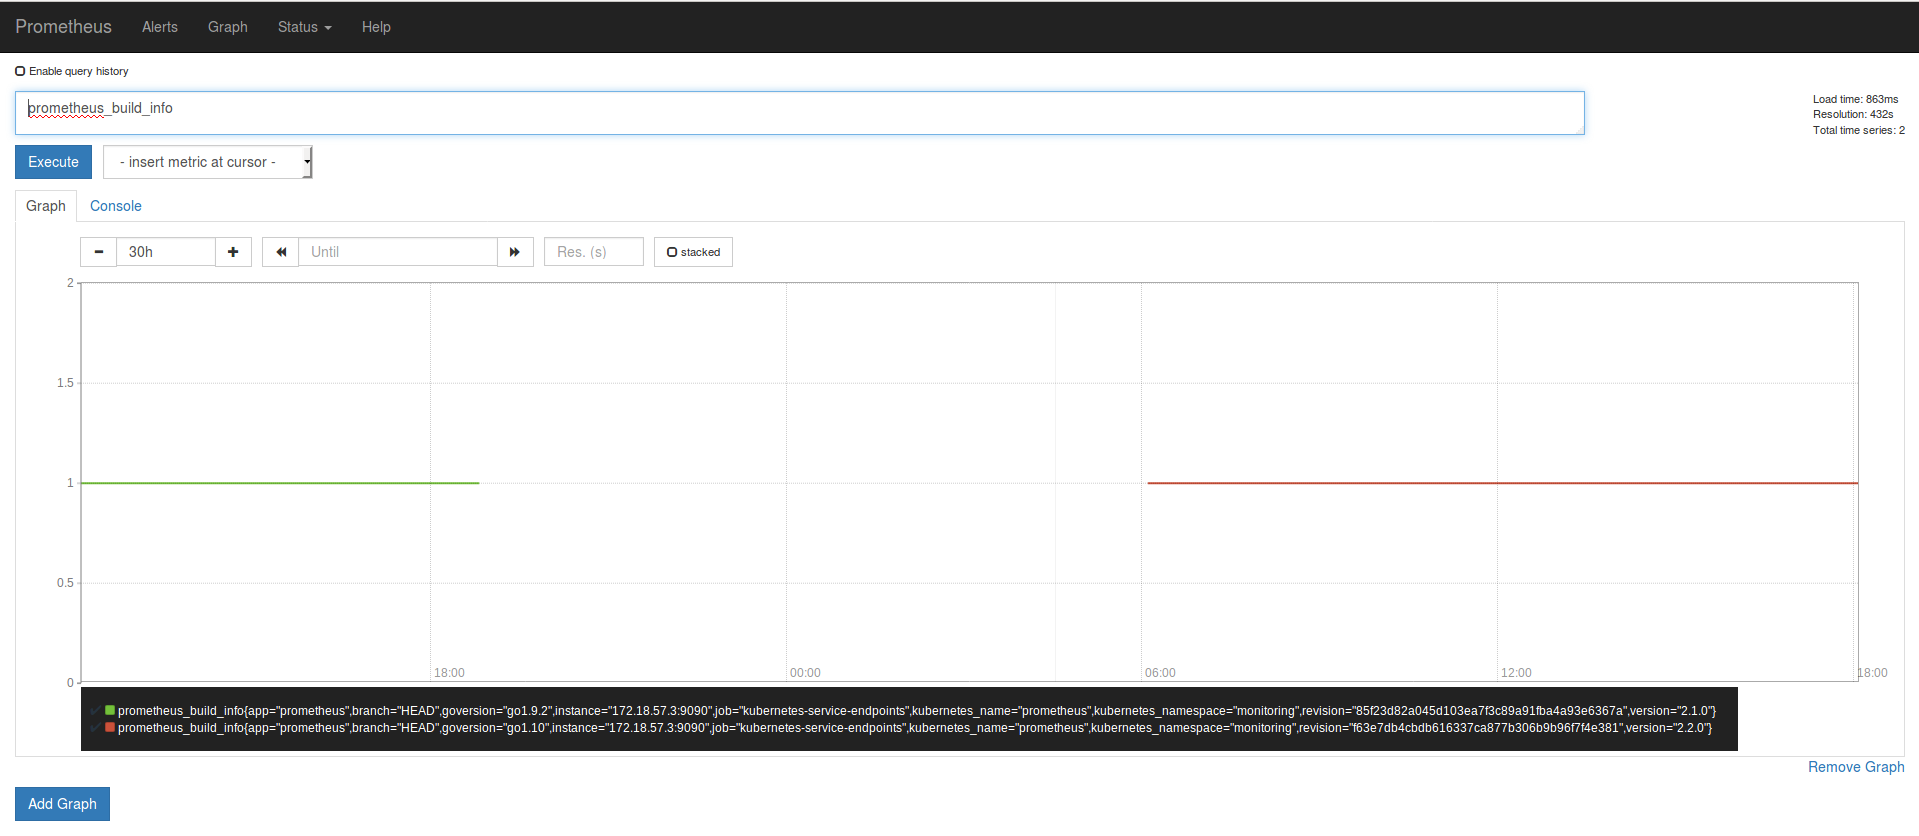
Prometheus Dashboard Production Ireland

I know this look really sketchy. But I didnt had restart or network error on the environments that run Prometheus. Thats why I choose a Prometheus metric as a example but all metrics where affected.
About this issue
- Original URL
- State: closed
- Created 6 years ago
- Reactions: 3
- Comments: 59 (40 by maintainers)
Commits related to this issue
- net-analyzer/prometheus: Mask 2.2.0 globally due to storage bug Details: https://www.robustperception.io/new-features-in-prometheus-2-2-0/ https://github.com/prometheus/prometheus/issues/3943 — committed to gentoo/gentoo by klausman 6 years ago
- compact: Exclude last block with shortest range instead of newest one by ULID. Fixes https://github.com/prometheus/prometheus/issues/3943 issue. Added tests. Signed-off-by: Bartek Plotka <bwplotka@... — committed to bwplotka/tsdb by bwplotka 6 years ago
- repair + compact: Improved logging for easier future debug purposes. This is based on my experience while debugging https://github.com/prometheus/prometheus/issues/3943. I needed to deduct few thing... — committed to bwplotka/tsdb by bwplotka 6 years ago
- repair + compact: Improved logging for easier future debug purposes. This is based on my experience while debugging https://github.com/prometheus/prometheus/issues/3943. I needed to deduct few thing... — committed to bwplotka/tsdb by bwplotka 6 years ago
- repair + compact: Improved logging for easier future debug purposes. This is based on my experience while debugging https://github.com/prometheus/prometheus/issues/3943. I needed to deduct few thing... — committed to bwplotka/tsdb by bwplotka 6 years ago
- repair + compact: Improved logging for easier future debug purposes. This is based on my experience while debugging https://github.com/prometheus/prometheus/issues/3943. I needed to deduct few thing... — committed to bwplotka/tsdb by bwplotka 6 years ago
Ok, we found bug & root cause. No block was deleted - just compaction wrongly ignores some blocks in certain cases. The ignored block (12h) is most likely laying around, but no one is using it. Debugging repro: https://github.com/prometheus/tsdb/pull/298
Fix in progress.
EDIT: Fix in review https://github.com/prometheus/tsdb/pull/299
I have just uploaded updated packages to Debian (2.2.1+ds-2), they should hit the mirrors in a few hours. Sorry for the mistake!
@trnl yes as far as I know, after my fix will land.
That’s good, because on second glance by looking on @hgranillo meta files you gave me this “ignored” block might be actually dropped. ): So, I am no longer sure if this missing block is actually recoverable.
@Bplotka, are you gonna make 2.2.1 release with that?
Impact will be hard to measure; one would hope that any organizations that depend on data in the longer would be more conservative in running .0 releases; I know we are.
If it’s done, it probably makes more sense to put the functionality in promtool. Otherwise, it becomes a game of “when can we drop this again”.
The question is if that should be carried in prometheus or promtool.
I’m seeing a similar issue; updated to 2.2 at 2018-03-08 22:02:17 UTC - there’s a big hole in my metrics until about 8 hours later. Fortunately, this is just a pilot, but concerning nonetheless. Nothing stands out in the logs other than, perhaps:
Mar 8 22:02:19 xxx prometheus: level=warn ts=2018-03-08T22:02:19.54858458Z caller=head.go:320 component=tsdb msg=“unknown series references in WAL samples” count=7
right after the upgrade