prometheus: Compaction process almost caused OOM Kill.
Compaction process almost caused OOM Kill. Is it possible to reduce the memory usage during compaction? what is the right compaction settings I should use?
What did you do? Have prometheus with 1 million series and after only 7 days of run I saw spike of 20GB (from steady stay of 5GB). According to the prometheus logs the spike started and finished during 4 compaction actions (15 minutes all, see logs below).
metrics process_resident_memory_bytes and container_memory_working_set_bytes during the spike.
Looking on
process_resident_memory_bytesit indicates for almost OOM kill (because VM with 21GB memory limit), while oncontainer_memory_working_set_bytesno risk of OOM. Question: which one of these metrics should I look for to indicate the real memory usage that can cause OOMKill (We have memory.limit of 21GB on the prometheus pod)

Picture with compaction duration and process_resident_memory_bytes at the same time of the spike:
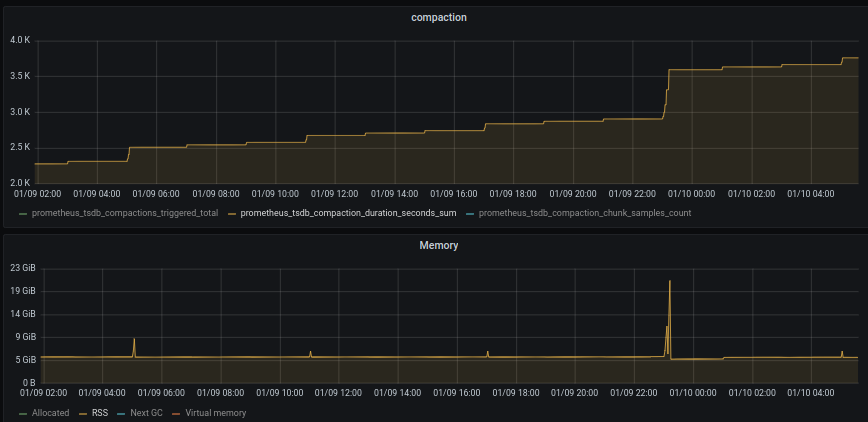
- RSS and compaction few days before the spike
Looking in the last few days you can see there is compaction that increase RSS but usually go up from 5GB to 10GB at most, but the big spike I mentioned above was from 5GB to 20GB which could lead to OOM if it goes up a bit more.


What did you expect to see? Expect compaction process to not cause OOM.
What did you see instead? Under which circumstances? just spike from 5GB to 20GB during 15 minutes of compaction process.
Environment
-
System information:
-
prometheus v2.22.1 (Nov 5, 2020)
-
Installed on GKE with prometheus operator, installed via helm chart.
-
Running on instance with 4 cores and 26 GB RAM (eventually GKE take 2GB so eventually its 24GB. And I set prometheus container memory limit to 21GB)
-
Prometheus configuration
-
- job_name: rlec
  honor_timestamps: true
  scrape_interval: 30s
  scrape_timeout: 30s
  metrics_path: /
  scheme: https
  tls_config:
    insecure_skip_verify: true
  static_configs:
  - targets:
     - target1
     - target2
     # And many other targets
- Prometheus important Command-Line Flags
storage.remote.flush-deadline		1m
storage.remote.read-concurrent-limit	10
storage.remote.read-max-bytes-in-frame	1048576
storage.remote.read-sample-limit	50000000
storage.tsdb.allow-overlapping-blocks	false

storage.tsdb.max-block-duration	18d
storage.tsdb.min-block-duration	2h

storage.tsdb.no-lockfile		        true
storage.tsdb.retention			0s
storage.tsdb.retention.size		0B
storage.tsdb.retention.time		180d
storage.tsdb.wal-compression	true
storage.tsdb.wal-segment-size	0B
- Note: the
storage.tsdb.max-block-durationis automatically set to 18d which is 10% of thestorage.tsdb.retention.time.
- Logs (prometheus container logs during the spike):
level=info ts=2021-01-09T21:00:40.863Z caller=compact.go:494 component=tsdb msg="write block" mint=1610215200000 maxt=1610222400000 ulid=01EVMF5Y1AWGX4BCM2XEAGV9BR duration=34.805323121s
level=info ts=2021-01-09T21:00:45.107Z caller=head.go:809 component=tsdb msg="Head GC completed" duration=1.227377019s
level=info ts=2021-01-09T21:00:45.460Z caller=checkpoint.go:96 component=tsdb msg="Creating checkpoint" from_segment=756 to_segment=765 mint=1610222400000
level=info ts=2021-01-09T21:01:00.318Z caller=head.go:889 component=tsdb msg="WAL checkpoint complete" first=756 last=765 duration=14.858391783s
level=info ts=2021-01-09T21:02:02.906Z caller=compact.go:440 component=tsdb msg="compact blocks" count=3 mint=1610193600000 maxt=1610215200000 ulid=01EVMF7NM2VQ20YQAV190E9Q7Z sources="[01EVKTJRF237RFYD9PMVNM1WE9 01EVM1EFQ0ATM35S7DN74T4JKF 01EVM8A6Z0Q8EHX5A8MVTY9X6Z]" duration=59.927493283s
level=info ts=2021-01-09T21:02:05.794Z caller=db.go:1152 component=tsdb msg="Deleting obsolete block" block=01EVKTJRF237RFYD9PMVNM1WE9
level=info ts=2021-01-09T21:02:05.895Z caller=db.go:1152 component=tsdb msg="Deleting obsolete block" block=01EVM8A6Z0Q8EHX5A8MVTY9X6Z
level=info ts=2021-01-09T21:02:05.972Z caller=db.go:1152 component=tsdb msg="Deleting obsolete block" block=01EVM1EFQ0ATM35S7DN74T4JKF
level=info ts=2021-01-09T21:03:51.400Z caller=compact.go:440 component=tsdb msg="compact blocks" count=3 mint=1610150400000 maxt=1610215200000 ulid=01EVMF9NJAHMVQW64M2KYDJ548 sources="[01EVK61AMM4SXGB7KZBX1E2DJG 01EVKTMHEVY2BS2E5TD3PEV9FC 01EVMF7NM2VQ20YQAV190E9Q7Z]" duration=1m42.941761733s
level=info ts=2021-01-09T21:03:54.299Z caller=db.go:1152 component=tsdb msg="Deleting obsolete block" block=01EVK61AMM4SXGB7KZBX1E2DJG
level=info ts=2021-01-09T21:03:54.602Z caller=db.go:1152 component=tsdb msg="Deleting obsolete block" block=01EVKTMHEVY2BS2E5TD3PEV9FC
level=info ts=2021-01-09T21:03:54.930Z caller=db.go:1152 component=tsdb msg="Deleting obsolete block" block=01EVMF7NM2VQ20YQAV190E9Q7Z
level=info ts=2021-01-09T21:07:27.878Z caller=compact.go:440 component=tsdb msg="compact blocks" count=3 mint=1610020800000 maxt=1610215200000 ulid=01EVMFD00PE0X030VB4M1JVNKF sources="[01EVGKPQ5AB8PGF53F1QPZNT5H 01EVJHG5NDSZ8QKK8QY1D0QYAT 01EVMF9NJAHMVQW64M2KYDJ548]" duration=3m30.415932572s
level=info ts=2021-01-09T21:07:31.220Z caller=db.go:1152 component=tsdb msg="Deleting obsolete block" block=01EVMF9NJAHMVQW64M2KYDJ548
level=info ts=2021-01-09T21:07:31.882Z caller=db.go:1152 component=tsdb msg="Deleting obsolete block" block=01EVGKPQ5AB8PGF53F1QPZNT5H
level=info ts=2021-01-09T21:07:32.879Z caller=db.go:1152 component=tsdb msg="Deleting obsolete block" block=01EVJHG5NDSZ8QKK8QY1D0QYAT
level=info ts=2021-01-09T21:12:16.219Z caller=compact.go:440 component=tsdb msg="compact blocks" count=3 mint=1609632000000 maxt=1610215200000 ulid=01EVMFKMYFVKFRKTW5RZJCDJKJ sources="[01EV8WD1S7EC5ZP9ZDAPP9R2Z7 01EVEP0FWPQ284HH7ZWXQFH8CZ 01EVMFD00PE0X030VB4M1JVNKF]" duration=4m40.715703432s
level=info ts=2021-01-09T21:12:19.114Z caller=db.go:1152 component=tsdb msg="Deleting obsolete block" block=01EV8WD1S7EC5ZP9ZDAPP9R2Z7
level=info ts=2021-01-09T21:12:19.915Z caller=db.go:1152 component=tsdb msg="Deleting obsolete block" block=01EVEP0FWPQ284HH7ZWXQFH8CZ
level=info ts=2021-01-09T21:12:21.129Z caller=db.go:1152 component=tsdb msg="Deleting obsolete block" block=01EVMFD00PE0X030VB4M1JVNKF
level=info ts=2021-01-09T23:00:45.013Z caller=compact.go:494 component=tsdb msg="write block" mint=1610222400000 maxt=1610229600000 ulid=01EVMP1NF1PYG5DJJV5J02FG00 duration=38.772847679s
level=info ts=2021-01-09T23:00:48.960Z caller=head.go:809 component=tsdb msg="Head GC completed" duration=1.286573607s
NOTE: I will mentioned that I have few more prometheus instances that do the same but on different targets. All of them started at the same time and I saw this spike at the same time on all of them! Here is a wider graph with more prometheus instances at the same time:

references
I actually search about this and found few issues on the same thing but not sure what is the proposed solution.
- https://github.com/prometheus/prometheus/issues/4110 but was closed with no resolution.
- https://github.com/prometheus-operator/prometheus-operator/issues/3724 -> looks like there is no way to set
storage.tsdb.max-block-duration - https://github.com/prometheus/prometheus/issues/6184 -> but again no resolution.
- https://github.com/prometheus/prometheus/issues/7483 -> looks more related to 32bit VM, so not sure if related.
About this issue
- Original URL
- State: closed
- Created 3 years ago
- Comments: 25 (14 by maintainers)
Thanks a lot guys for your collaboration on this ticket.
So based on the analysis and the golang documentation @roidelapluie mentioned :
Summary of the ticket
process_resident_memory_bytesmetric that prometheus exposes do not really reflect the memory usage of prometheus, this metric may indicate on a higher memory usage then the prometheus is actually using.container_memory_working_set_bytesmetric (You have this metric only if you run it from k8s).go_memstats_heap_inuse_bytesmetric its probably also good indication about prometheus memory usage, but its showing a bit lower numbers thencontainer_memory_working_set_bytes. So not sure 100% if we can rely on it but it defiantly much better thenprocess_resident_memory_bytesmetric.@codesome @SuperQ @roidelapluie please approve and let me know if I can close this ticket.