calico: Memory leak in Calico 3.0.5 with etcd ds
For some reason many calico-nodes in different clusters had memory leaks in last few weeks. Affected multiple clusters on-prem and one cluster in aws (independent users, so no way that same app was deployed). Did not affect functionality tho, we only see alerts on CPU/MEM consumption far above requests (default ones CPU 250m and MEM 100Mi)
We noticed CPU spikes and increasing consumption along with memory leak. Memory leak stabilized on around 400MB. I see that it’s calico-felix process in all the cases. Nothing major in logs and calico behaves fine.
Expected Behavior
No memory leaks (8x times).
Current Behavior
Memory leak from ~50MB to ~400MB
Possible Solution
Similar bug, but for KDD not etcd.
Steps to Reproduce (for bugs)
I have no steps to reproduce unfortunately, open for possible suggestions what to check.
Context
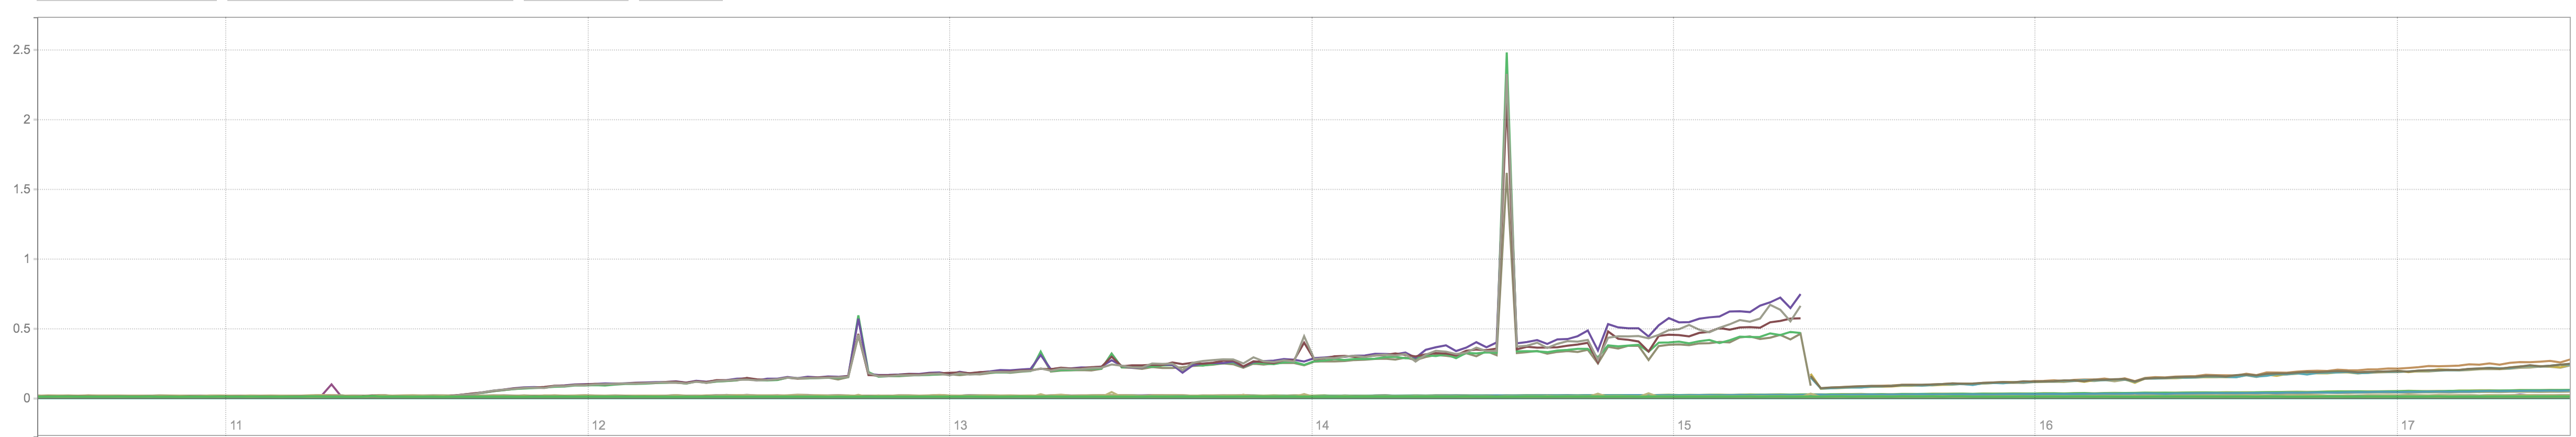
CPU
sum by(cluster_id, pod_name) (rate(container_cpu_usage_seconds_total{cluster_id=~"[a-z,0-9]{5}",cluster_type="guest",pod_name=~"^calico-node.*$"}[15m]))
AWS installation
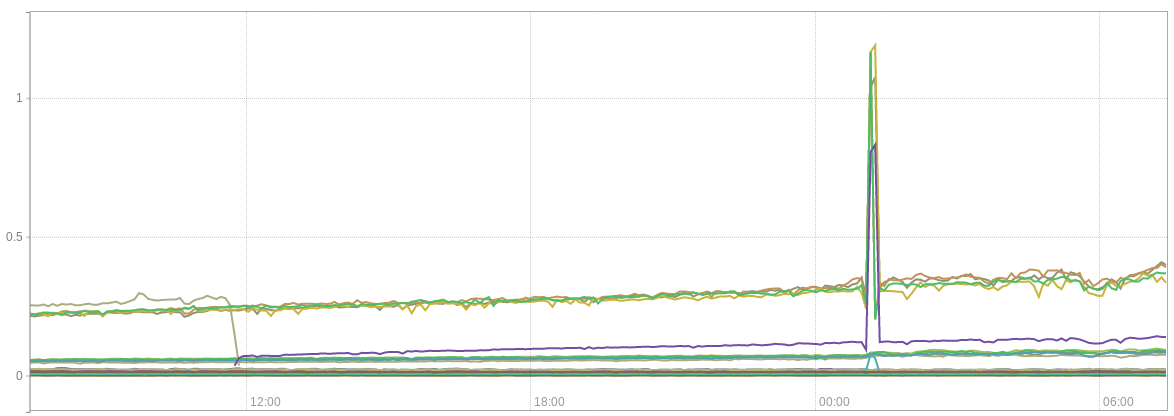
on-prem installation
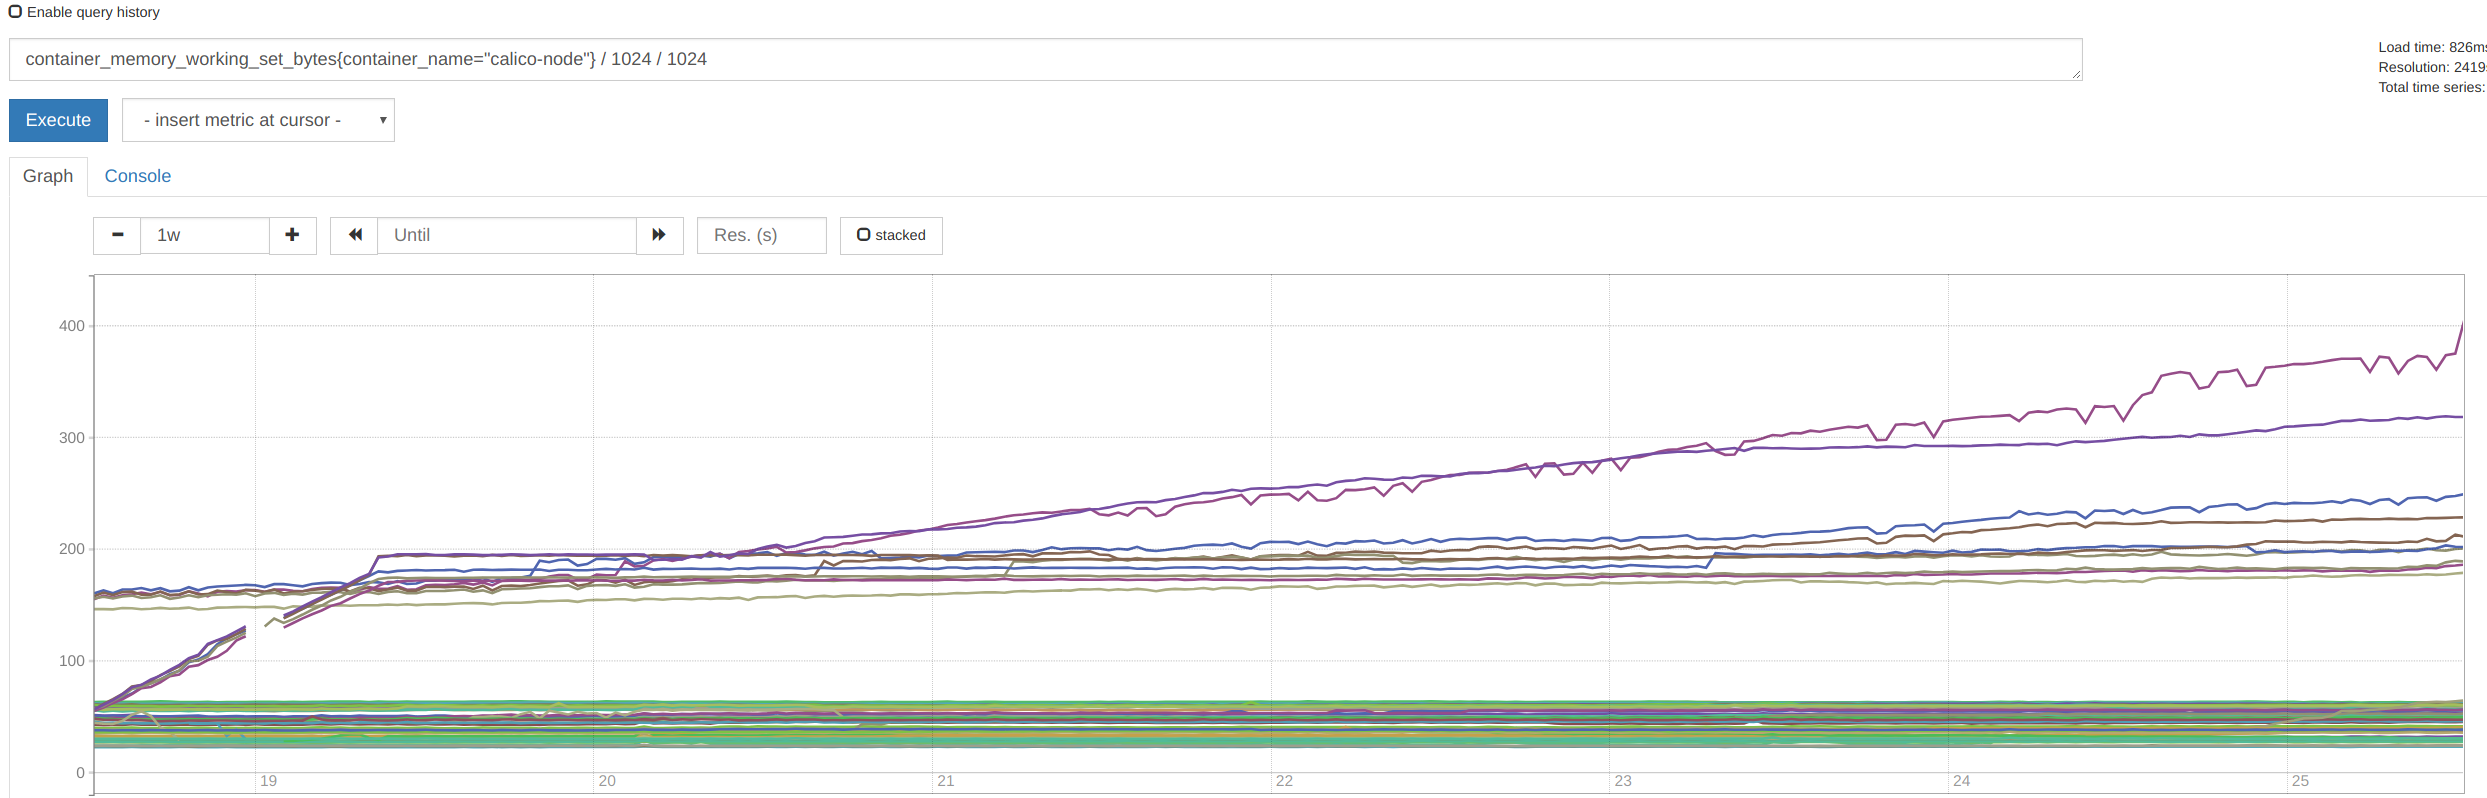
Memory
(container_memory_working_set_bytes{container_name="calico-node"} / 1024 / 1024) > scalar(avg(kube_pod_container_resource_requests_memory_bytes{cluster_type="guest",container="calico-node"} / 1024 / 1024)) * 2.5
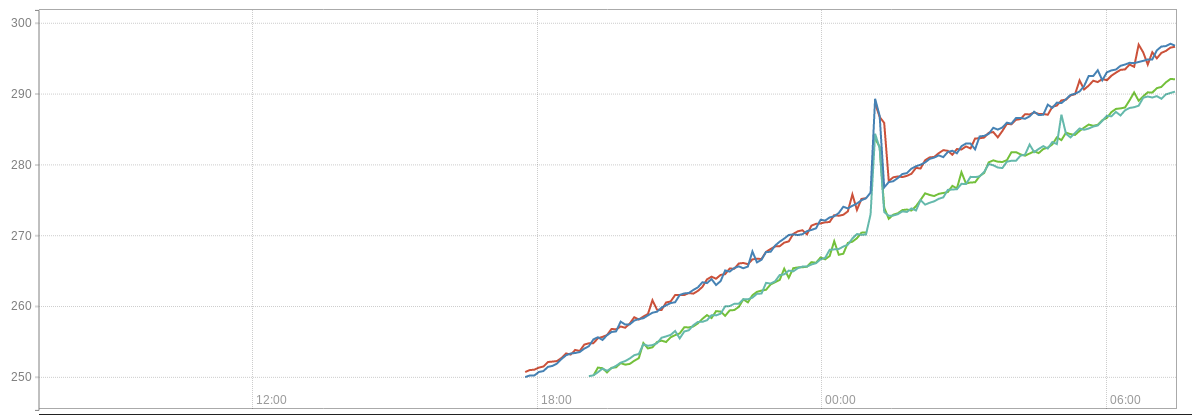
Current memory consumption on-prem (leak started week ago) (leak happened in two clusters, both have the same version 1.10.1 + calico 3.0.5)
top from calico-node that consumes 400MB
Mem: 39439948K used, 74013232K free, 4394704K shrd, 87388K buff, 10823120K cached
CPU:  17% usr   0% sys   0% nic  81% idle   0% io   0% irq   0% sirq
Load average: 2.20 2.51 1.62 1/2428 14711
  PID  PPID USER     STAT   VSZ %VSZ CPU %CPU COMMAND
  106    99 root     S     340m   0%   4   0% calico-felix
  104   102 root     S    42960   0%  10   0% confd -confdir=/etc/calico/confd
  105   101 root     S    22800   0%   4   0% bird6 -R -s /var/run/calico/bird6.ctl -d -c /etc/calico/confd/config/bird6.cfg
  103   100 root     S    18796   0%   9   0% bird -R -s /var/run/calico/bird.ctl -d -c /etc/calico/confd/config/bird.cfg
14704     0 root     S     1592   0%   4   0% sh
14711 14704 root     R     1520   0%   8   0% top
    1     0 root     S      768   0%   2   0% /sbin/runsvdir -P /etc/service/enabled
  101     1 root     S      748   0%   9   0% runsv bird6
  100     1 root     S      748   0%   1   0% runsv bird
   99     1 root     S      748   0%   2   0% runsv felix
  102     1 root     S      748   0%   7   0% runsv confd
/ # netstat -nptu | wc -l
394
/ # iptables -t nat -S | wc -l
477
/ # iptables -S | wc -l
983
Your Environment
- Calico version 3.0.5 (etcd datastore with IPIP tunnels)
- Orchestrator version: k8s 1.10.1
- Operating System and version: CoreOS
- Link to your project (optional):
About this issue
- Original URL
- State: closed
- Created 6 years ago
- Comments: 16 (16 by maintainers)
I think i have no doubt on closing this.
At a guess, we’re getting disconnected from etcd (or etcd is returning an error) and we’re doing a datastore resync so worth digging into whether there was a disruption in the etcd cluster at that time (the time of the CPU spike) or a connectivity problem.
@r7vme In preparation fo the next time you see this, please can you set environment variable
FELIX_ DebugMemoryProfilePath=/tmp/felix-mem-<timestamp>.pprofon your calico-node containers, then, if you see a leak again, you can trigger felix to dump a memory profile to disk by sending felix a SIGUSR1sudo pkill -USR1 calico-felix. It might be useful to have a dump from before and after the leak for comparison (or two dumps a few hours apart after it starts leaking). The dump will be written to the configured directory inside the container so you’ll need to grab it from there or mount in a directory to catch it. Recording a dump is pretty non-invasive, it only takes about a second and setting that config param doesn’t noticeably impact performance.