oshi: OSProcess calculateCpuPercent() seems to return problematic values (OSHI 4.1)
Running a test whereby I have multiple threads running infinite loops in the background in order to max my machine CPU utilization at 100%, I poll the OS processes every five seconds. Using the code from the SystemInfoTest class, I get output which looks like this: TOP TEN PROCESSES IN ORDER OF UTILIZATION:
   PID  %CPU %MEM    VSZ           RSS   Name
    0  7.6     0.0        8 KiB         8 KiB Idle
14728  7.4     0.0     1.8 GiB 316.6 MiB javaw
4648  0.2     0.0 335.6 MiB     6.5 MiB SnippingTool
    4  0.1     0.0   10.8 MiB       20 KiB System
1584  0.1     0.0 771.4 MiB  222.5 MiB dwm
3616  0.0     0.1 467.1 MiB      1.5 GiB eclipse
7752  0.0     0.0      2.1 GiB  199.6 MiB OUTLOOK
3304  0.0     0.0  170.5 MiB     9.3 MiB audiodg
10472  0.0     0.0       1.1 GiB      55 MiB Teams
13092  0.0     0.0   379.1 MiB    6.1 MiB ptoneclk
Here’s what Windows Task Manager looks like at the same time:
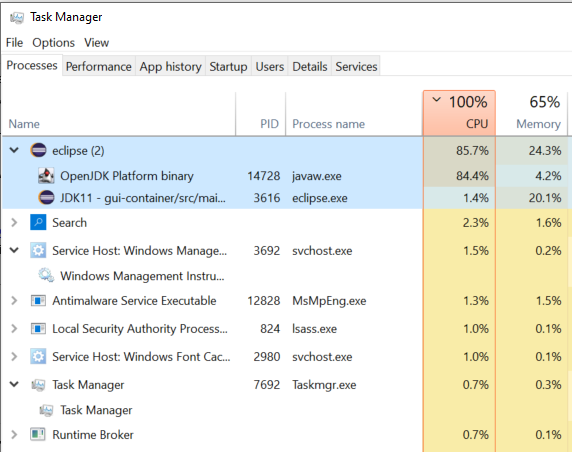
At various times, Task Manager ™ shows javaw.exe at 94.9 to 98.1%, but javaw.exe from the OSProcess doesn’t go above 7.5. Seperately, why is it 7.5? If it is a decimal percentage and I multiple by 100, it would be 750…that certainly isn’t correct either. Please help. Thank you.
About this issue
- Original URL
- State: closed
- Created 5 years ago
- Comments: 23 (12 by maintainers)
Yes but it parses into Excel oh-so-sweetly. 😃
The other option is to link a log.
Based on the tick counts, I don’t see a problem in OSHI – at least as far as the ticks. The timestamps cover 10 seconds (10,000 ms) – 9.928 seconds by timestamps. Uptime is correctly reporting 10175 milliseconds. In the sample, there’s not much idle time recorded but your
javawprocess has consumed 78265 ms of processor time (that’s almost 100 percent on an 8-virtual-core system).That doesn’t tell me where the 7.5 comes from. Are you replicating OSHI’s calculation or did you do your own? Based on the Tick count in this sample I see 78625/10175 = which is 769%. (Again, this is *nix-style usage where you can get > 100% on multithread processes; divide by # of processors to get the windows results.)
Thank you so much for looking at this. I’m implementing the means, using OSHI, to monitor users’ machines so that if a user reports any kind of issue with our application; usually a perceived lag or an actual freeze of the UI, this behavior will correspond to some metric that OSHI can report on, such as a spike in network activity or some other application on the affected user’s machine grabbing the majority of CPU time. The output to our logs when these incidents occur are first looked at by various levels of support personnel in call centers, and when necessary, are brought to our (the developers) attention. Thus, I need to be able to log numbers that make sens to the support personnel. That said, I will gather the additional metrics and post here. Thank you again for creating and maintaining OSHI. I had been using SIGAR, but as you know, that is a difficult API to work with, primarily because of the lack of documentation, and the fact that it is a dead project, although it does provide extremely broad and deep API. Unfortunately, it does not work with Java 9+, so it has to go.