hydrogen: Altair visualization library doesn't work
Hello!
I’ve been working with your package lately and it’s really great. Unfortunately, it fails to display the output of the Altair library. I try running this code from their homepage:
from altair import Chart, load_dataset

# load built-in dataset as a pandas DataFrame
cars = load_dataset('cars')

Chart(cars).mark_circle().encode(
    x='Horsepower',
    y='Miles_per_Gallon',
    color='Origin',
)
Notebook

Hydrogen

Notebook output contents
<div class="output_subarea output_html rendered_html"><div class="vega-embed" id="c21b9d22-57b7-4cc8-9edf-bac5abf1c864">
  <div class="vega" style="position: relative;">
    <canvas width="624" height="405" class="marks">
    </canvas>
  </div>
  <div class="vega-actions">
    <a href="#" target="_blank" download="vega.png">Export as PNG</a>
    <a href="#">View Source</a>
    <a href="#">Open in Vega Editor</a>
  </div>
</div>

<style>
.vega-embed svg, .vega-embed canvas {
  border: 1px dotted gray;
}

.vega-embed .vega-actions a {
  margin-right: 6px;
}
</style>
</div>
Hydrogen output contents
<div class="bubble-output-container">
  <div class="bubble-result-container">
    <div class="vega-embed" id="c8ff3624-14a1-4ad8-b422-bbaa30bdba13">
    </div>

    <style>
      .vega-embed svg, .vega-embed canvas {
        border: 1px dotted gray;
      }

      .vega-embed .vega-actions a {
        margin-right: 6px;
      }
    </style>
  </div>
  <div class="bubble-error-container plain-error">
  </div>
  <div class="bubble-status-container hidden" style="height: 21px">
    ...
  </div>
</div>
I am under the impression that the package that is used to embed Altair’s graphics is https://github.com/vega/ipyvega, but I am not familiar with Altair’s source enough to tell for sure.
So, does support for this library have to be added to Hydrogen by hand or is something broken here?
About this issue
- Original URL
- State: closed
- Created 8 years ago
- Comments: 19 (15 by maintainers)
We will support Vega and Vega-Lite in the upcoming release: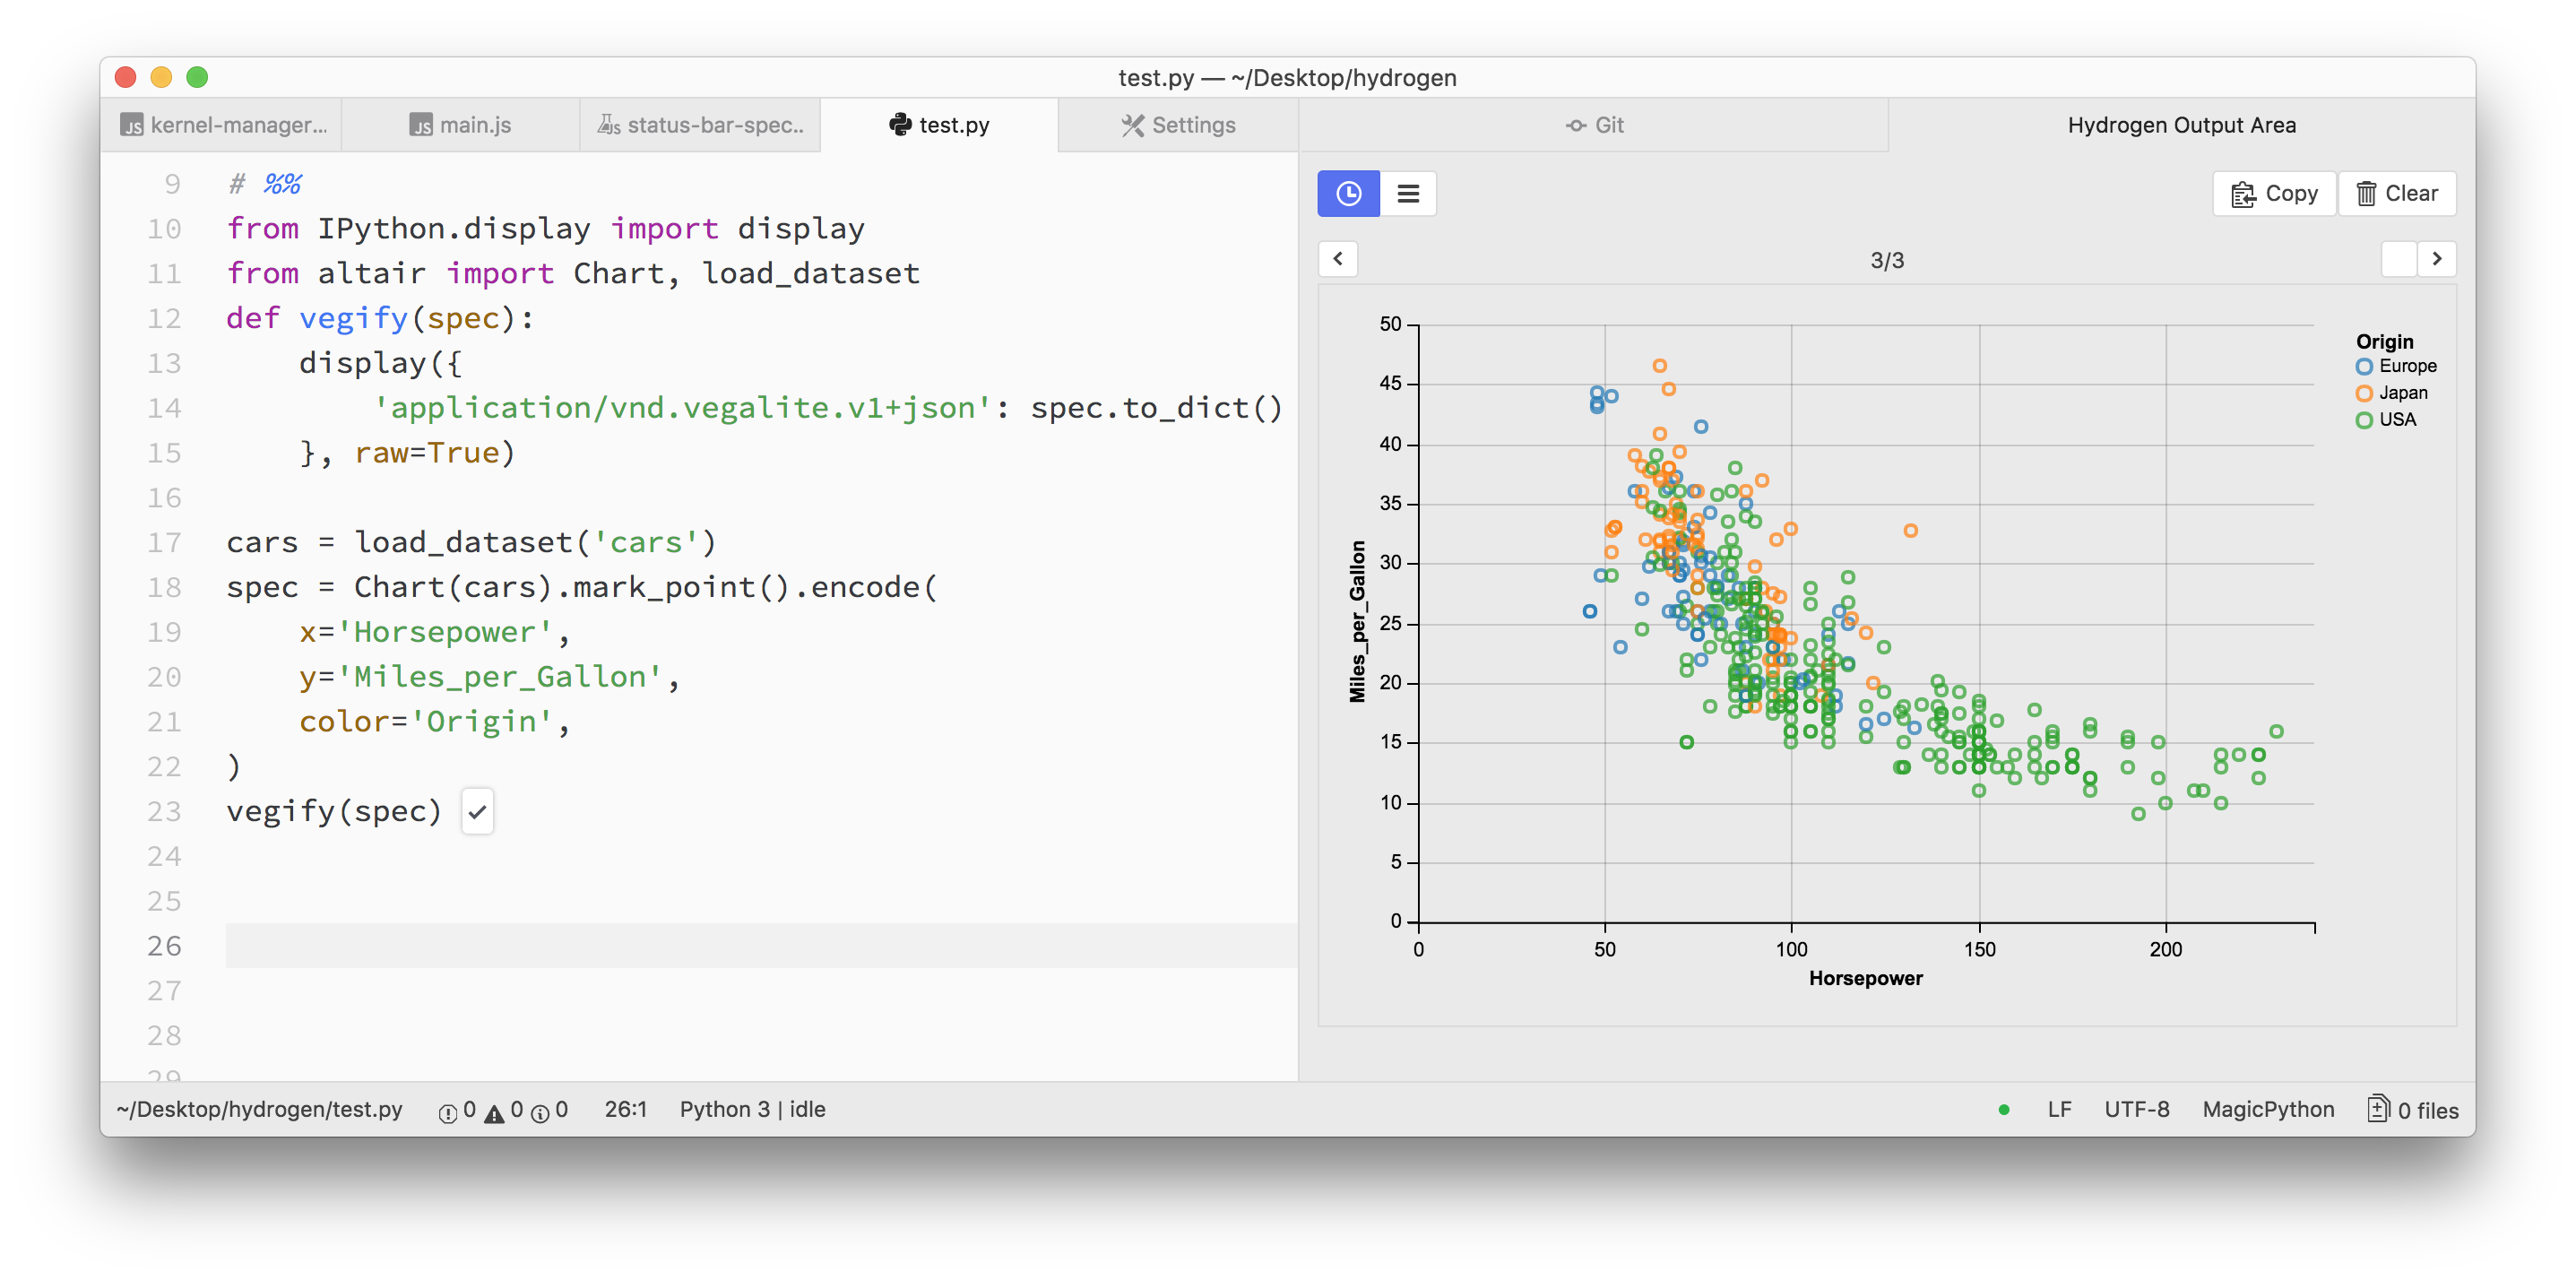
As of today’s release of Hydrogen, we support Vega 3 and Vega-lite 2. Slick interactives!
Based on the Altair FAQ, it needs an nbextension in order to draw graphs. Link: https://altair-viz.github.io/faq.html#id2
Nbextensions are part of the notebook, not hydrogen, so it’s not clear what can be done to fix this.
(On phone, sorry for brevity)
Note for folks who come across this thread: For Altair version 2.0 or newer, the above
vegifyfunction is not required. The good news is that nteract will correctly display Altair plots by default once nteract’s dependencies are updated and it supports Vega version 3.X and Vega-Lite version 2.X. The bad news is that until those dependencies are updated, it will not be possible to display Altair plots correctly in nteract.If you want to use Altair in the meantime, please try another front-end, such as nteract desktop, nteract-on-jupyter, JupyterLab, Jupyter Notebook, or CoLab.
Will be fixed once Atom 1.20.0 is stable.
We would certainly welcome a pull request with that. 😄
They wouldn’t be too hard to add right now, it would probably be better to do it after nteract/nteract exports more modules so we don’t have to maintain it in so many places.
The way we handle vega in nteract/nteract right now is a custom renderer/transform for mimetypes
application/vnd.vega+jsonandapplication/vnd.vegalite+json. It currently requires the user to form a custom payload though:Resulting notebook: