nx: node --inspect/--inspect-brk incompatible with nx task runner
Current Behavior
on node --inspect-brk ./node_modules/.bin/nx build best-app, post attach, I cannot debug due to port conflict:
Debugger listening on ws://127.0.0.1:9229/10537d99-1102-40aa-8820-a5993dce9841
For help, see: https://nodejs.org/en/docs/inspector
Debugger attached.

> nx run best-app:build
Starting inspector on 127.0.0.1:9229 failed: address already in use
Waiting for the debugger to disconnect...
Port 9229 is otherwise free–it is not used until this very node process begins.
Expected Behavior
node --inspect-brk $(yarn bin)/nx build best-app to allow me to debug my application’s build pipeline
Steps to Reproduce
reproduction and instructions can be found here: https://github.com/cdaringe/nxtester/tree/demo/no-debugging
About this issue
- Original URL
- State: closed
- Created 4 years ago
- Reactions: 4
- Comments: 18 (3 by maintainers)
@isaacplmann Got debugging working in VSCode. I’d be happy to collaborate on a debugging techniques document if you want to make a template I can add to.
@jkolyer it seems that other people have found solutions. What specific command are you having trouble debugging? I always use the Javascript Debug Terminal in VS Code to debug things.
Javascript Debug Terminaldebugger;or using VS code’s breakpoints)nx run my-app:build)Here are some docs talking about this method: https://nx.dev/latest/angular/generators/workspace-generators#with-visual-studio-code
Thanks for reporting the issue 😄
This is due to
forkbeing used to run the command… We’ll have to investigate how to handle this…If you want to debug the actual build… you should inspect the
taodirectly.I think it’s worth to mention that debugging preferences is also available via project.json files.
As you can see in the image, I’m runnning 3 different projects (Express API) on diferent ports and debugging 2 of them (the other one is disabled for example purposes).
Debugging 1st app on port 9230Debugging 2nd app on port 9231Last app with debugging disabledAll 3 apps running alltogetherMore details at NX Website
Sorry to post on closed issue but I encounter the same issue as well. I need to debug tests and take memory snapshots. When launch node --inspect-brk ./node_modules/@nrwl/cli/bin/nx test backend It outputs
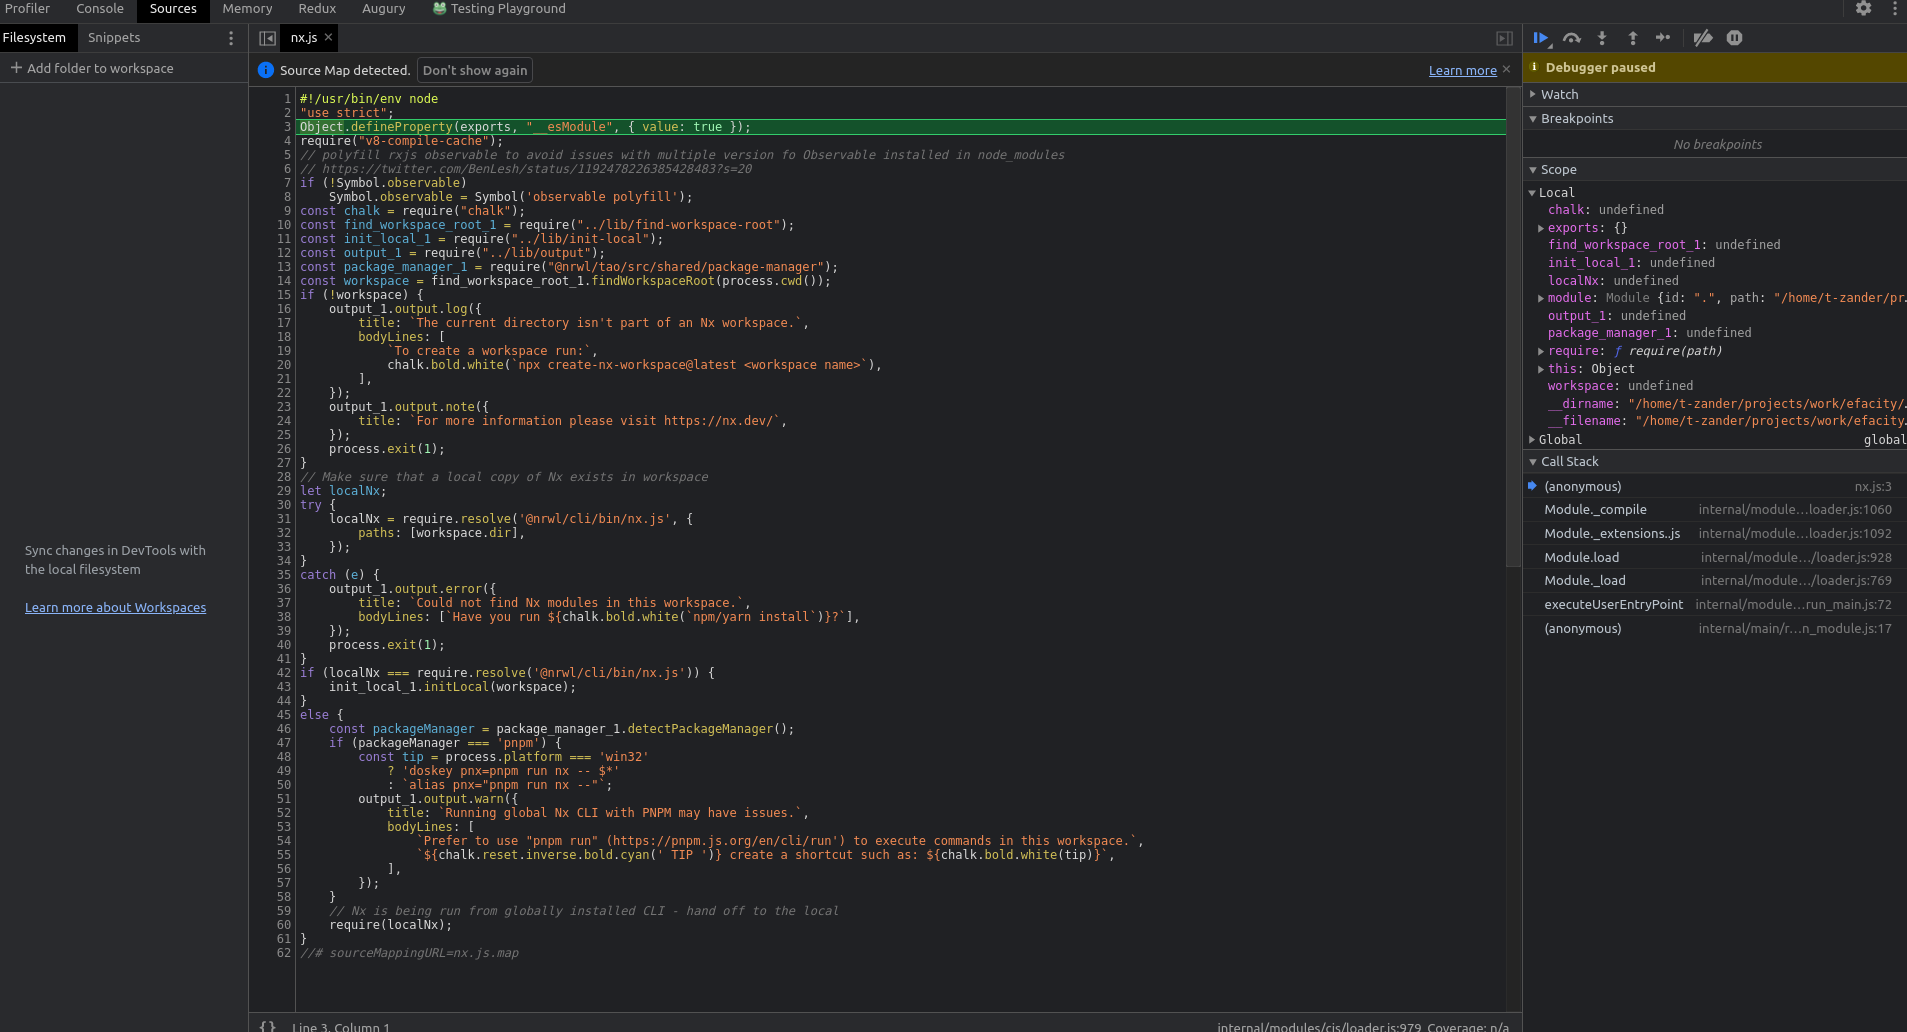
Then I go to chrome://inspect Click on Open dedicated DevTools for Node https://prnt.sc/12m6csh
It opens devtools and steps into Is it proper behavior?
Sourcestab automatically. There I can see some code which seems to be coming from some nx files.Then I get an error
If I try to take any snapshots it just hangs on a random percentage value and debugger is disconnected (I cannot see nx workspace in
chrome://inspectanymore. Tests continue to run and I cannot stop them with ctrl + c.Please help me. I spent nearly one day on this issue and still unable to debug any tests.
node --inspect-brk=0 ./node_modules/@nrwl/cli/bin/nx test libname works but in a little bit unexpected way. First run spins debugger on port
38687After going to devtools and pressing on
Resume script executionit runs the following scriptNow debugger is listening on another port
Go to chrome://inspect and add this new port by pressing
Configurebutton. dev tools window opens and goes to sources tab automatically. Now the file name isrun-cli.jsRemote Target now contains two itemsResume script execution this time in
run-cli.jsNow able to take some snapshotsThere are two things you can do:
NX_SKIP_TASKS_RUNNER=true node --inspect ./node_module/.bin/nx build blahwill not fork the process. You should really avoid doing this.node --inspect=0 ./node_module/.bin/nx build blahwill use a random port as @june07 described.We cannot really fix because we need to create multiple processes to enable caching and when using run-many.
@isaacplmann can you make we have a guide in the docs talking about debugging?
Try this link: https://nx.dev/packages/node/executors/node