npgsql: Migration from 2.2.7 to 6.0 made the execution of commands slower
Migration from 2.2.7 to 6.0 made the execution of commands slower.
DB
PostgreSQL version: 13.3
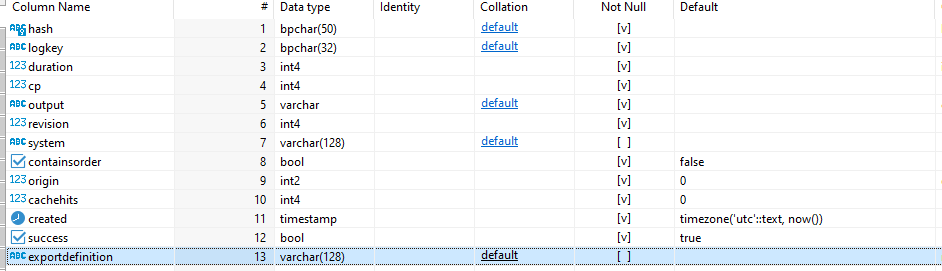
target table
How I do it in 2.2.7
Connection string: "UserId=postgres;Password=pass;Server=db;Database=database;Timeout=30;CommandTimeout=240;Port=5432;Encoding=UNICODE;Pooling=true;MaxPoolSize=100;"
- Open connection:
public static NpgsqlConnection OpenConnection(string connectionString = null) {
  NpgsqlConnection connection = null;
  try {
    if (connectionString.IsNullOrEmpty())
      connection = new NpgsqlConnection(GetConnectionString());
    else
      connection = new NpgsqlConnection(connectionString);
    connection.Open();
  } catch (Exception ex) {
    EventLogHelper.WriteEntry(ex);
  }
  if (connection != null && connection.State != ConnectionState.Open)
    connection = null;
  return connection;
}
- Command & Execution
public static CacheResult TryFindCache(string base64Hash, DBConn dbConn) {
  try {
    using var command =
        new NpgsqlCommand("SELECT output FROM calccache WHERE hash = @hash",
                          dbConn.Connection, dbConn.Transaction);
    command.Parameters.AddWithValue("@hash", base64Hash);
    using(NpgsqlDataReader reader = command.ExecuteReader()) {
      if (reader.HasRows && reader.Read()) {
        string output = reader.GetString(0);
        CacheResult result = ...
        return result;
      }
    }
  } catch (Exception ex) {
    ...
  }
  return null;
}
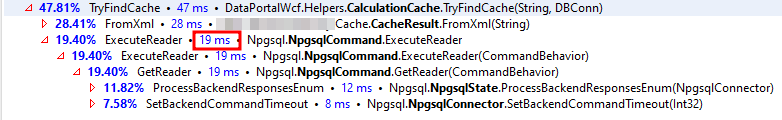
- dotTrace - 19 ms.
How I execute my command in 6.0:
Connection string: "Host=db;Port=5432;Username=postgres;Password=pass;Database=database;Timeout=30;Command Timeout=240;Pooling=true;Minimum Pool Size=10;Maximum Pool Size=100;Persist Security Info=true"
- Open connection - same
- Command & Execution
public static CacheResult TryFindCache(string base64Hash, DBConn dbConn) {
  try {
    using var command =
        new NpgsqlCommand("SELECT output FROM calccache WHERE hash = @hash",
                          dbConn.Connection, dbConn.Transaction);
    command.Parameters.AddSmart("@hash", base64Hash);
    using(NpgsqlDataReader reader = command.ExecuteReader()) {
      if (reader.Read()) {
        string output = reader.GetString(0);
        CacheResult result = ...
        return result;
      }
      reader.Close();
    }
  } catch (Exception ex) {
    ...
  }
  return null;
}
- Custom extension for parameters:
public static NpgsqlParameter AddSmart<T>(
    this NpgsqlParameterCollection collection, string paramName, T value,
    NpgsqlDbType? type = null, bool keepEmptyString = true) {
  // Is nullable?
  NpgsqlParameter parameter;
  if (value is null) {
    parameter = new NpgsqlParameter(paramName, DBNull.Value);
  } else {
    if (value is string strValue) {
      var isNull = keepEmptyString && strValue == string.Empty;
      parameter = new NpgsqlParameter(paramName, isNull ? DBNull.Value
                                      : strValue);
    } else {
      parameter = Nullable.GetUnderlyingType(typeof(T)) !=
                  null
                        ? new NpgsqlParameter(paramName, value)
          : new NpgsqlParameter<T>(paramName, value);
    }
  }

  if (type.HasValue) parameter.NpgsqlDbType = type.Value;

  collection.Add(parameter);
  return parameter;
}
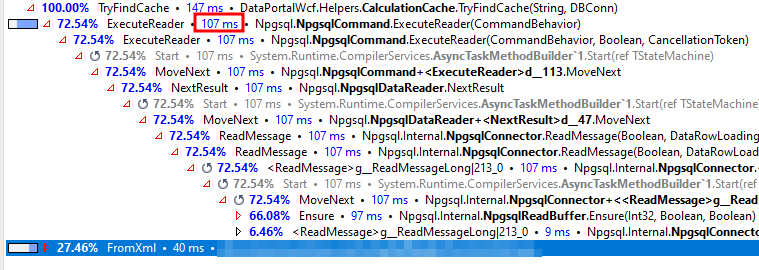
- dotTrace - 107 ms.
The issue
As we can see in the previous screenshots, the difference in execution of ExecuteReader() is huge.
Any thoughts on why it’s so slow?
And is there any possible solution?
Operating system: Windows
About this issue
- Original URL
- State: closed
- Created 2 years ago
- Comments: 20 (10 by maintainers)
OK, to explain what’s going on. Since around 3.0 Npgsql started using an extended query protocol (which allows us to send parameters as a separate entities), instead of a simple query protocol (where we had to inline the parameters into the query). Now, the issue here is, if with the simple query protocol the query plan looks like this:
Essentially, cast the param text to
bpcharand after that filter all the rows.With the extended query protocol the plan looks like this:
Treat the param as text and cast every
hashvalue frombpchartotext, using that as a filter.I don’t know whether that’s an intended Postgres behavior (that is, not casting the param type and instead casting the column value) and we’re supposed to explicitly tell that the param type is
bpchar, or a bug, but that’s how it works right now.BTW you can enable automatic prepared statements for 6.0, which should also make things slightly faster. You can find more info here.
@vonzshik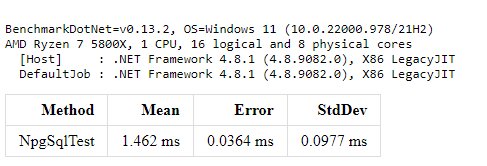 Yes😃
Yes😃
I’ve done a quick test, and these are the results I’ve got.
Npgsql 2.2.7:
Npgsql 6.0.6:
Note that I was running it against a local database with an empty table.
@happybald from the looks of it, most of the time is spent in the database executing the query. Could you confirm this for both version of npgsql by enabling PostgreSQL logging?