napari: Slow access to ome-zarr at lower levels
🐛 Bug
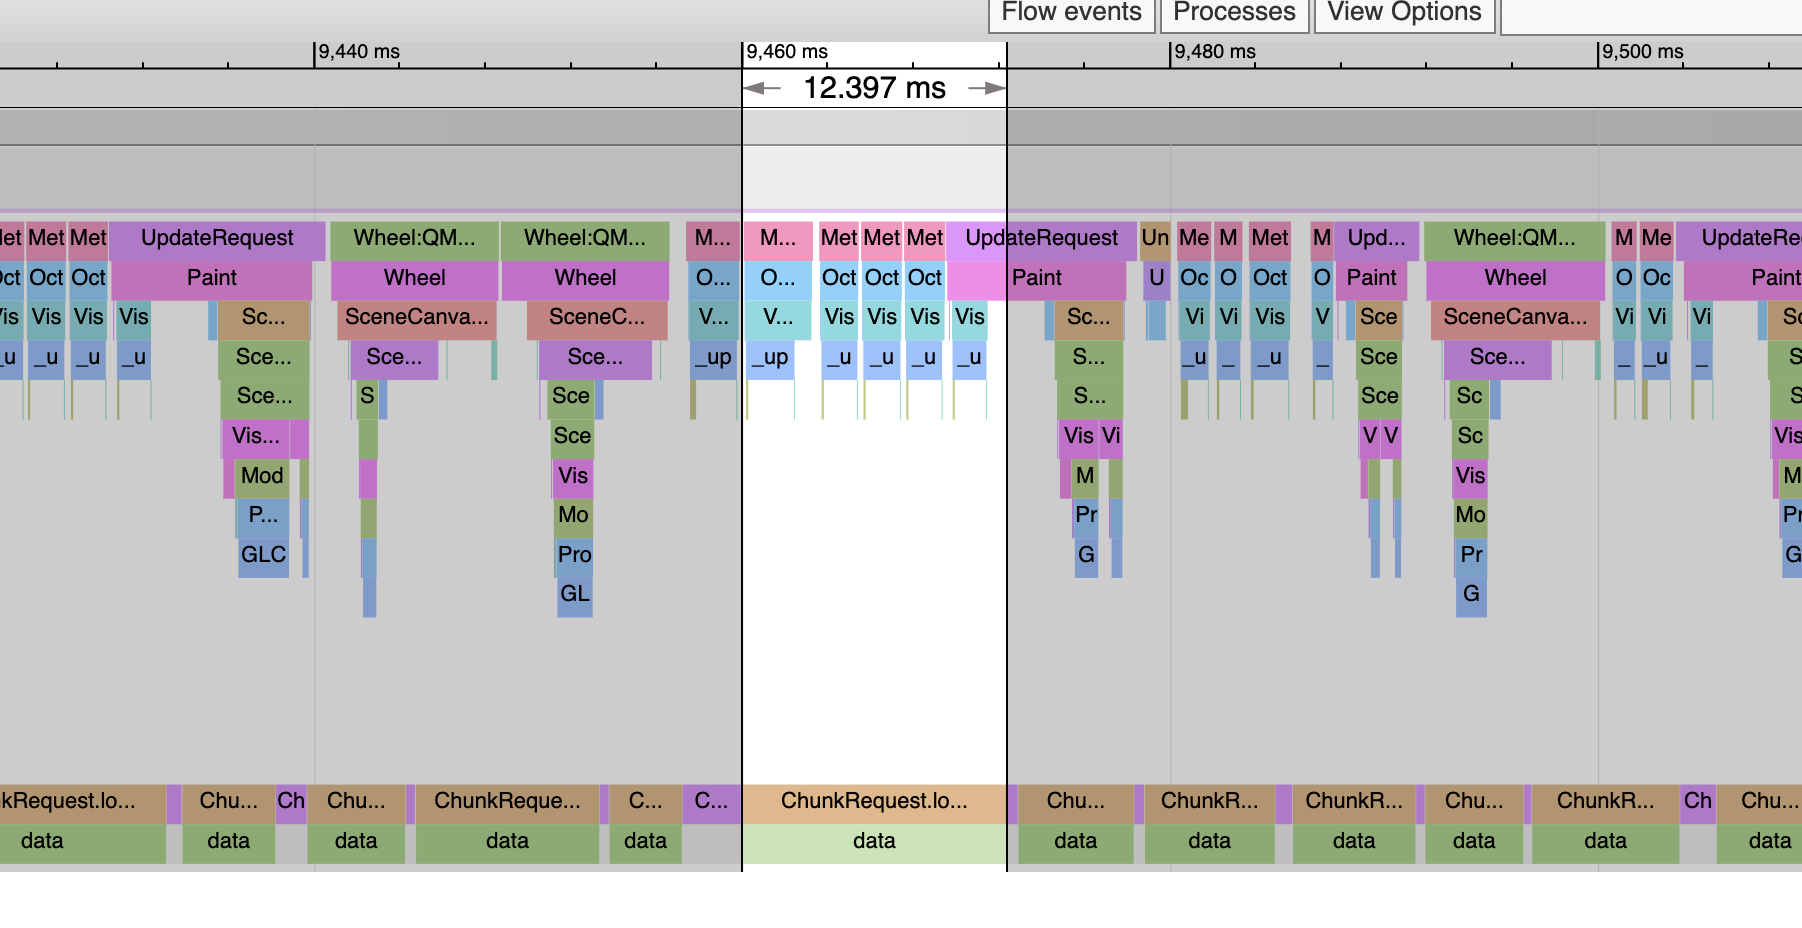
For a while, I’ve observed when I zoom into 4495402.zarr off SSD with octree it gets slower the more you zoom. I assumed it was something with the octree code. But these traces show it’s the actual data loads that get slower. Here we are viewing a high level of the octree. This read was 12.4ms and it was one of the slower ones:

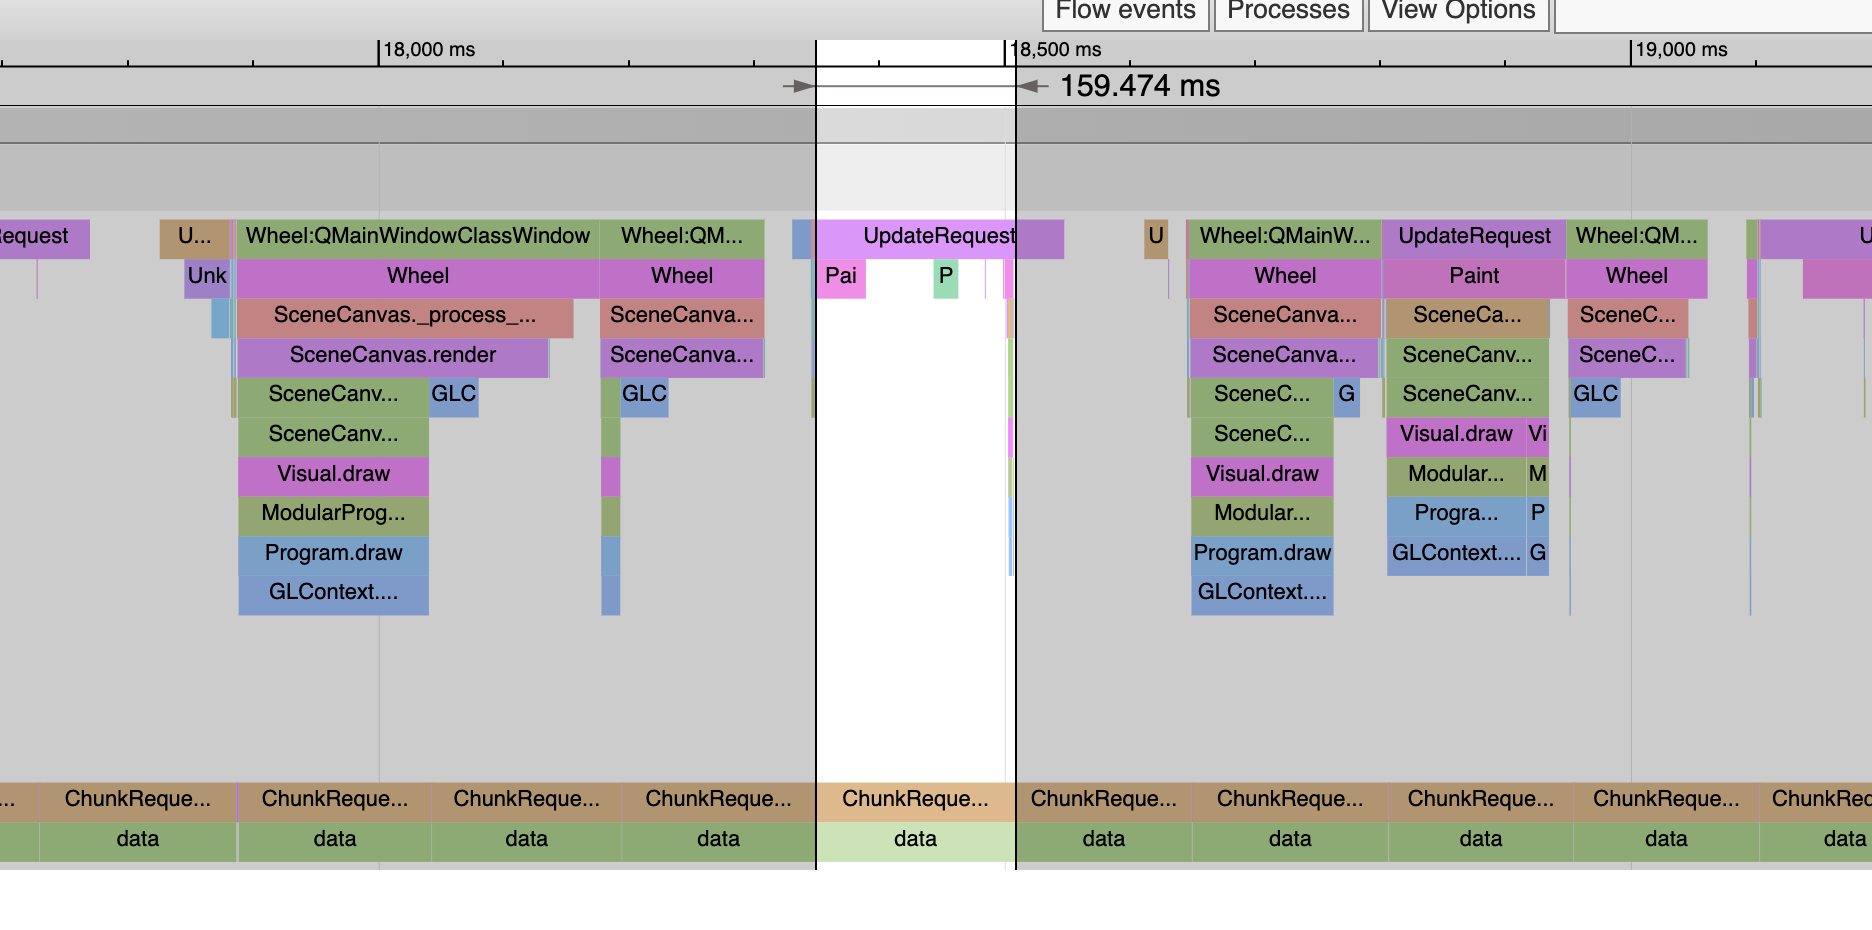
But here’s level 0 and now the loads are all over 150ms:

It’s very consistent too. You never see a slow read on a high level or a fast read on a level 0. Above notice that the draws have gotten slower in tandem with the reads getting slower. This is likely due to the GIL. One of these threads is slowing the other one down. But you can’t tell which is which. Are the reads making the rendering slow, or vice versa?
To see, I call this test routine when I create the slice:
def _test_speed(data):
    for i, level in enumerate(reversed(data)):
        with block_timer(f"level {len(data) - 1- i} asarray", print_time=True):
            np.asarray(level[0, 0])
Loading from an external SSD I get this output:
 level 7 asarray 6.500ms
 level 6 asarray 3.534ms
 level 5 asarray 3.649ms
 level 4 asarray 3.989ms
 level 3 asarray 5.988ms
 level 2 asarray 12.994ms
 level 1 asarray 49.613ms
 level 0 asarray 189.473ms
So this implies the reads are causing the rendering to be slow, not the reverse. It implies to me these reads are doing a ton of CPU work, and that’s slowing down the rendering. Although note even if the rendering was fast, the loads would still be happening slowly. That is, we’d have a high framerate but we’d be watching the tiles slowly pop in.
So just calling np.asarray to get one pixel takes 189ms on level 0. I don’t know if the issue here is OME, Dask, Zarr or something else? However, we saw something like this with Dask a while back. Where something ran much slower then expected. Note that level 0 here is huge:
380928 x 921600 = 351.1 billion pixels.
It could the number of Dask chunks is really big, and there’s some cost that proportional to the number of chunks? If so should we be using larger chunks? Or more than one level of chunks?
We need the load time to be a lot faster if we are going to render it quickly. The ping time from US to Europe is around 150ms which is what we are getting from the SSD here.
About this issue
- Original URL
- State: open
- Created 4 years ago
- Comments: 31 (31 by maintainers)
I’m labeling this as wontfix because this part of the codebase has been changed/deprecated. We can revisit/close later.
I have seen this on HPC filesystem (one user mistakenly created 2.5B files across 3 month, one float number per file…), if there are “few enough” files the data is inline in inodes; otherwise you start to have indirection layers, that slow things down.
I’ll try to find some time to dig into this; and/or try to see if fix it in spec v3 impl if it’s something core to how zarr v2 works.
Hi all and thanks for this fascinating discussion! I must admit that
really surprised me and revealed some deep misunderstanding I have about how dask works.
I 100% think the dask folks are interested in improving things for this use case — linear time random access indexing seems like very bad performance in many contexts, not just real time rendering. CC @mrocklin @jakirkham @GenevieveBuckley. In general, to answer your specific questions @pwinston, my intuition is that bigger/massive chunks is a bit of a hack and I would instead aim to get at the root cause of the problem within dask itself — zarr and da.map_blocks show that there’s no fundamental reason why smallish chunks should hurt performance quite so much.
In my experience using
da.map_blocksvsda.{stack,concatenate}, it’s just night and day. I had a quick look at theda.from_zarrandda.from_arraywhich is what it resolves to, and I don’t know offhand whether it would create one or the other kind of graph. There’s probably a way to usemap_blockson the output ofzarr.open. The dask-image PR for this is a good model of how to usemap_blocksgenerically. There’s two other examples in my rootomics and napariboard-proto demos.In general, it would be good to get dask working well (a) just for its own sake, but (b) because zarr is generally eager in giving you numpy arrays with indexing, something we’ve struggled with in the past. But as a stopgap, yes, I will try to prioritise in the next couple of days a PR to ome-zarr-py to improve performance with this use case, either through using zarr.open instead of dask, or through using map_blocks on top of that.
Again, thanks @pwinston for the investigation, definitely taught me some things about dask!
Yeah, the zarr file is 1MB/chunk. We know dask does not read a full chunk because with 16GB chunks it takes only 5ms to read a pixel. And that time is basically invariant to chunk size. As long as the chunks are not super small, the reads are basically the same for all chunk sizes.
I’m sure Dask does read a full chunk with all its computational pipeline stuff. The stuff it’s made for. But for simple reads, it seems to pass that through. Which is good for us. Until we need to do computations I guess.
But I figured out the crashes!!! It’s PyQt5 again. We had problems with PyQt5 and “scene graph changes”. For instance, our first tiled visual created one VisPy
ImageVisualper tile. That had constant crashes with PyQt5, but it worked with PySide2.That’s one reason we wrote the new
TiledImageVisualandTextureAtlas2D. Because that doesn’t change the scene graph. So that works with PyQt5 and Pyside2.But Dask chunk size changes also crashes with PyQt5. It does not crash with Pyside2:
So this is good for me, I can work with this. But it means napari really does need to solve the PyQt5 problem. So scene graph changes and dask changes both cause crashes. It could be just “doing stuff with memory” causes the crashes. Maybe memory on the C++ side?
I spent a few days looking at the crashes when the scene graph stuff was happening. I didn’t figure anything out. It’s a very tricky problem. It might be a bug with PyQt5, but it might be we are doing something wrong and PySide2 just happens to not care. We’re not sure which. @sofroniewn.