seaborn: FacetGrid legend missing colors in key
Code Sample, a copy-pastable example if possible
import pandas as pd
import matplotlib.pyplot as plt
import matplotlib.patches as patches
import seaborn as sns
sns.set_style('whitegrid')

test = sns.load_dataset("tips")
g = sns.FacetGrid(test,
                  col="sex",
                  hue="smoker",
                  size=4, aspect=1)
g = (g.map(sns.pointplot, "time", "total_bill").add_legend())
Problem description
For some reason I cannot get the colors from the plot to appear in the key:

Here is my setup:
INSTALLED VERSIONS
------------------
commit: None
python: 3.5.2.final.0
python-bits: 64
OS: Darwin
OS-release: 15.0.0
machine: x86_64
processor: i386
byteorder: little
LC_ALL: None
LANG: en_US.UTF-8
LOCALE: en_US.UTF-8
pandas: 0.19.0 seaborn: 0.7.1 matplotlib: 2.0.0 jupyter: 1.0.0 jupyter_client: 4.4.0 jupyter_console: 5.0.0 jupyter_core: 4.2.0
I was on a much earlier version of Matplotlib (1.5.1), and tried upgrading to 2.0 but that did not fix the issue.
About this issue
- Original URL
- State: closed
- Created 7 years ago
- Reactions: 2
- Comments: 16 (3 by maintainers)
@kning It is very explicit but it works.There is obviously something wrong with getting the patches from the FacetGrid object.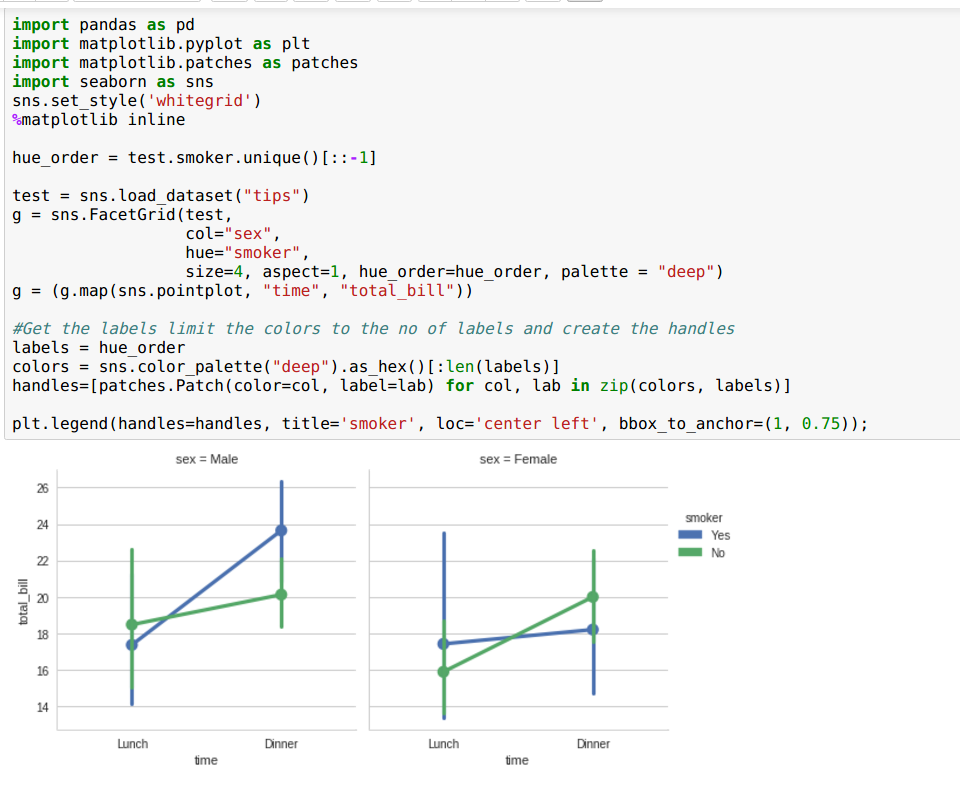
Is there a solution for this? Can
factorplotbe used with a custom map function like inFacetGrid?. I have a custom histogram function for plotting on each facet. It plots the data fine but I have the same issue with the legend missing the colors.