mitmproxy: poor interactive performance / hanging requests
i use mitmproxy for interactive browsing a lot. that is, i run an mitmdump instance continuously, and use it from multiple browsers on multiple computers.
recently this started to be a rather frustrating experience. i suspect it’s related to the new proxy core, or it could be related to debian upgrading to python 3.9? sadly it turned out non-trivial to roll this back.
initially after mitmproxy startup, everything works smoothly, but then suddenly stalls, many requests hang for a very long time until mitmproxy returns a response. sometimes this starts almost immediately, sometimes after hours, it possibly recovers by itself, but usually i give up waiting and restart mitmproxy. (most times the requests seem to do finish, but only after many minutes.) this is probably most easily reproduced with resource-heavy sites, like facebook.com, openstreetmap.org, …
in netstat, i don’t see mitmproxy having many connections to the destination servers open, so i suspect it’s an internal limitation.
( i typically check with $ netstat -ntp | grep EST.*python | grep -v :8080 | awk '{print $5}' | sort | uniq -c | sort -n)
my initial suspicion was that there is a limit on the number of concurrent connections, and that that pool is used up by connections that are in some invalid state and/or waiting for a timeout.
i already found a per-connection.address] limit at
https://github.com/mitmproxy/mitmproxy/blob/dc6c5f55cd25236e9469c24b85c8cafd29573281/mitmproxy/proxy/server.py#L84
and increased it significantly, but that did not lead to consistent improvements.
(i also added a warning on if self.max_conns[command.connection.address].locked():, but it doesn’t seem to trigger.)
can you suggest what else i could do to diagnose this?
is there another connection limit besides max_conns in proxy?
is there existing code/facilities to introspect/dump the currently open incoming connections and their state?
an option to log connection-level tracing info?
System Information
Paste the output of “mitmproxy --version” here.
(venv) user@host[~/mitmproxy]$ mitmproxy --version
Mitmproxy: 7.0.0.dev (+332, commit aebc40c)
Python:    3.9.1+
OpenSSL:   OpenSSL 1.1.1i  8 Dec 2020
Platform:  Linux-5.8.0-1-amd64-x86_64-with-glibc2.31
About this issue
- Original URL
- State: closed
- Created 3 years ago
- Reactions: 1
- Comments: 64 (62 by maintainers)
Commits related to this issue
- don't reuse closed connections, refs #4451 — committed to mhils/mitmproxy by mhils 3 years ago
- don't reuse closed connections, refs #4451 (#4458) — committed to mitmproxy/mitmproxy by mhils 3 years ago
- speculative HTTP/2 fixes, refs #4451 — committed to mhils/mitmproxy by mhils 3 years ago
- speculative HTTP/2 fixes, refs #4451 (#4464) — committed to mitmproxy/mitmproxy by mhils 3 years ago
We do indeed kill open connections after 10 minutes of total inactivity. In this case it sounds like the client is still waiting for a response for some reason. A log with
--set proxy_debug -vvvwould go a long way in identifying the root cause. Feel free to shoot that by email if you have sensitive stuff in there.I was able to reproduce this locally, this was quite a regression introduced in #4458. 😛 #4459 has the fix!
it appears that the issue with aliexpress disappeared when i removed
--set proxy_debug -vvv, so possibly it was the extra cpu load generated by the logging that caused the extreme slowness. (i had issues with that site before the fixes, so those were probably already resolved by your other changes.) i might still try the benchmark (with and without proxy_debug), but it doesn’t look like i’ll get to it soon.so if you like, this can be closed for now. thanks for this great tool and your dedication to improving it!
This isn’t super accurate, but
print(f"{len(self.active_flows)=}")in one of the event hooks in https://github.com/mitmproxy/mitmproxy/blob/master/mitmproxy/addons/save.py should give you a rough estimate. That does not include requests that have not reached therequestheadershook yet.On Windows, the page you linked only issues ~50 requests. Everything else is served as Emojis. 😄
three bugs down, and i’m afraid we’re not done here yet, but i’ll take a short break with http2 disabled to see how well that works.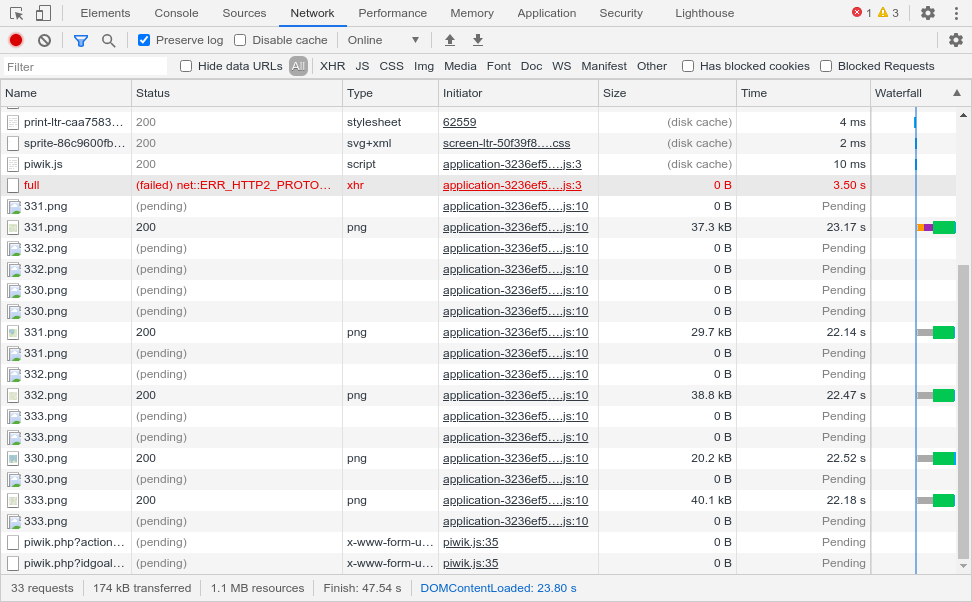
Kind of, it’s really quite straightforward. Here’s what was happening:
So yes - this one is embarassingly simple, and while we had tests for some super weird corner cases, we didn’t have for this one. It also didn’t come up in my testing, because usually I would try out tons of websites or applications, but not rest on a particular website for a prolonged period of time.
Ha, I think this had the missing hint! 🥳 I’m working on a fix. 😃
Excellent, thanks. Based on what you are describing, my assumption would be that
curlfrom a different window should still work fine, we’re “only” getting the browser in a state where all connections are stalled. That kind of stuff persists across browser tabs.Let me focus on
AttributeError: 'NoneType' object has no attribute 'state_machine'first, which seems like an easy bug in our HTTP/2 state machine. I can reproduce this locally on openstreetmap.org (#4452), which thank to you I learned is an excellent resource to uncover HTTP/2 race conditions. Better than testing with nytimes.com 😄 The OpenSSL one is puzzling. I can’t reproduce it and I don’t expect it to disappear after fixing #4452, but let’s tackle them one-by-one.